RCC Blog - Uploads to STB's Carload Waybill Sample

Updates to STB’s Carload Waybill Sample

Big improvements Coming to the STB’s Carload Waybill Sample

The best source for understanding railroad rates and volumes for commodities into specific markets is the STB’s Public Use Waybill Sample (Waybill). The Waybill contains information that can significantly impact a shipper’s rail negotiations. It can also positively impact decisions made in shipper’s marketing and sales departments. Improvements made to Waybill data are, therefore, important for shippers to understand.

There are two big improvements in the Waybill data for merchandise traffic that shippers must be aware of. The first improvement will go into effect later in 2021 or early 2022. The second improvement is still being studied by the STB.

Waybill Improvement 1

The upcoming 2020 Waybill will contain more rates, volumes, origins, and destinations for merchandise traffic rail movements. This means merchandise traffic will contain:

  • Increased number of origin and destination market areas.
  • More accurate estimates of specific commodity volumes going into markets.
  • More accurate estimates of where volumes into markets originate.
  • Improved information on rates shippers compete against in markets.

This increase in merchandise traffic data will be offset by decreasing the number of intermodal movements the Waybill contains. This change is being implemented because the Waybill is primarily used by merchandise traffic shippers. These improvements will go into effect with the release of 2020 Waybill data. The 2020 Waybill data is expected to be released in late 2021, or early 2022.

Waybill Improvement 2

If this improvement is implemented, the Waybill will be released Quarterly, not Annually. This improvement is still being studied by the STB. However, if this change is enacted, Waybill data will become much more current.

In the existing system, Waybill data is at least one year old. Much of the data is closer to two years old before the STB releases an updated Waybill. For example, if the Waybill data for year 2020 is released in December 2021, there will be a one-year lag in data for the fourth quarter of 2020. However, there will be close to a two-year lag for data from the first quarter of 2020.  The new quarterly Waybill system would only have a two-to-four-month delay in rate and volume information for all Waybill data.

Waybill Improvement 2 is important because the more current Waybill data is, the more useful Waybill data becomes!

Importance of Waybill Data

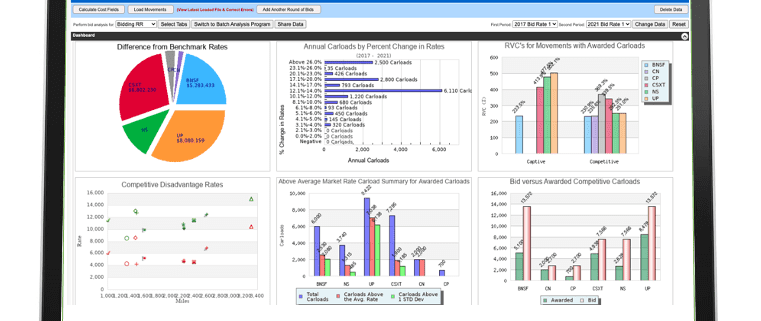
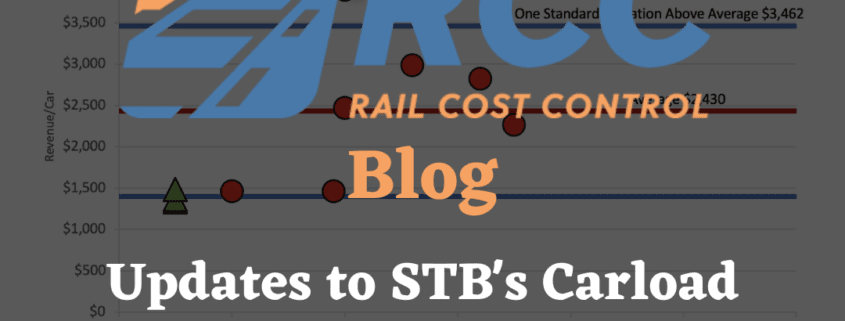
The importance of the Waybill data in determining reasonable rates for rail movements is shown in the following scatter graph:

Updates to STB’s Carload Waybill Statistics

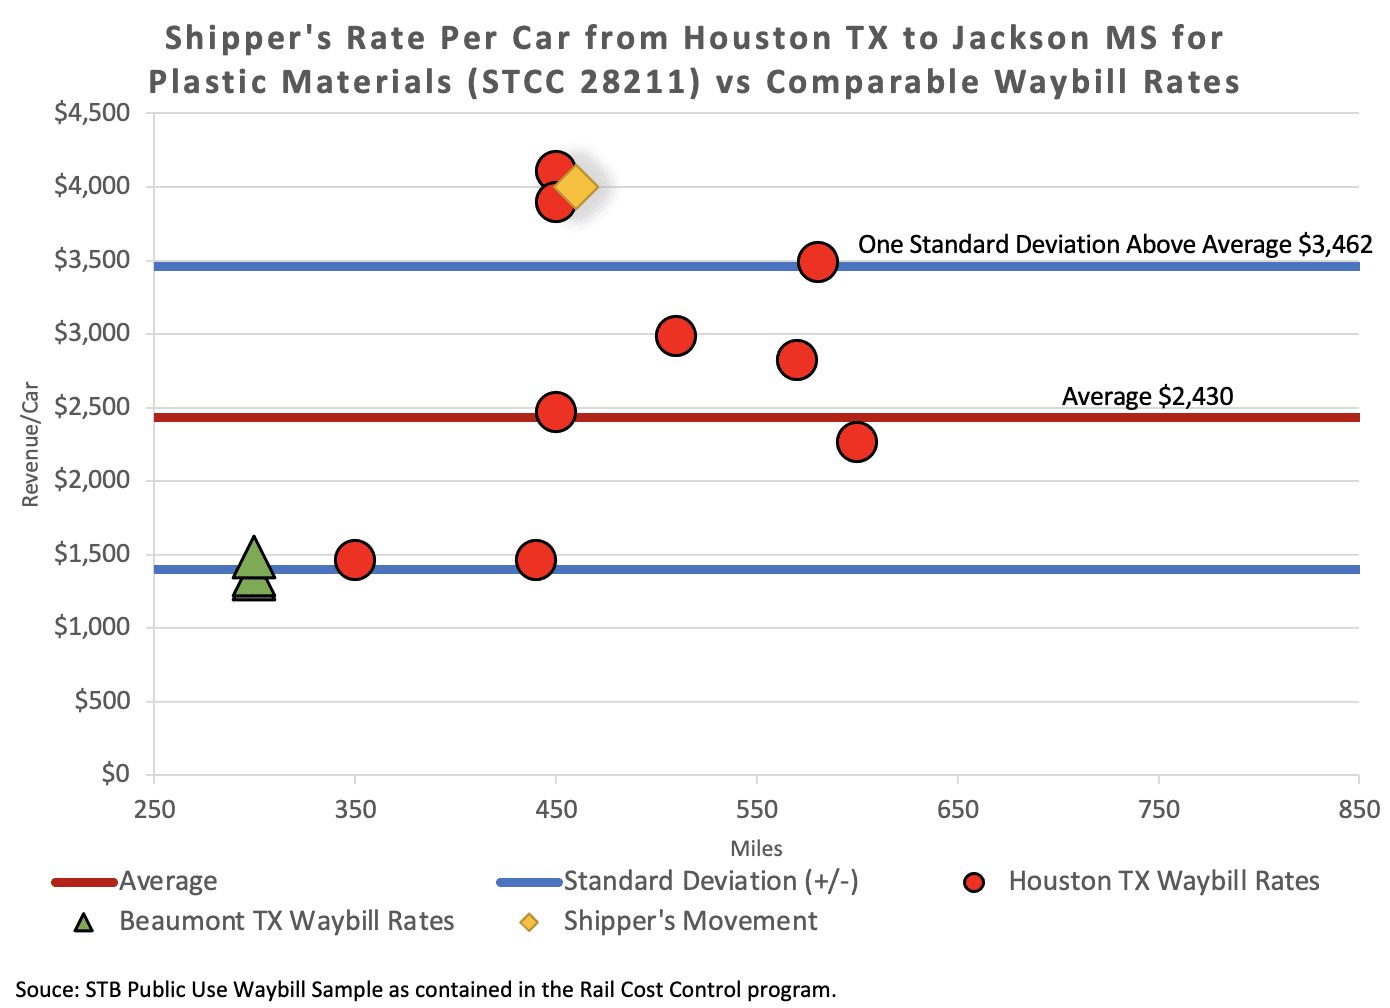
The scatter graph is automatically generated through the Rail Rate Checker Section of the Rail Cost Control Program

The graph shows the following data:

  • Shipper’s rate of $4,000 for a 450-mile Plastic (STCC 28211) movements from Houston, TX to Jackson, MS (yellow diamond)
  • Waybill rates for Plastic moves to Jackson, MS from both Houston, TX (red circles) and Beaumont, TX (green triangle)
  • A $2,430 Average Waybill rate into Jackson, MS (refer to the red line)
  • $3,462 is the rate that is One Standard Deviation above the average Waybill rate (refer to the top blue line)

The graph shows the value shippers get from access to Waybill data. The illustration provides a clear picture of the problems with the $4,000 rate for the shipper’s Plastic movements. The graph shows:

  • The $4,000 rate is more than One Standard Deviation above the Average rate into Jackson, MS
  • Houston rates are $1,000 to $2,5000 higher than rates out of Beaumont, TX
  • The $4,000 rate puts the shipper at a competitive disadvantage in the Jackson, MS market
  • It is difficult for the shipper to compete in this market with a $4,000 rail rate

The Waybill is already a very valuable tool for rail shippers. The STB’s proposed improvements to timeliness and number of moves, will increase the value of the Waybill for rail shippers.


Escalation Consultants, Inc. developed Rail Cost Control (“RCC”)  to help shippers reduce rail expenses by managing costs and empowering negotiations. Furthermore, for more information about RCC and other related articles, visit the RCC Blog.

Rail Cost Control

RCC Blog - Historical Data Shippers Need

Historical Data Shippers Need

There is little information available on policies and practices shippers rail transportation departments are using to control their cost of rail freight. As a result:  

There is little direction for shippers to follow on changes that can be made within the transportation department to obtain better results from railroads. 

The results of the survey taken at Escalation Consultants’s recent webinar, “Creating Opportunities to Reduce Rail Expenses” are therefore very informative as they provide:

  • Information on the current state of the art in shippers rail transportation departments and 
  • Food for thought on changes that can be made in transportation departments to obtain better rates from railroads

One of the most interesting results was: 83% of shippers said that better access to historical results for their moves would improve negotiations with railroads. It is difficult to get people to agree on 83% of anything, so this indicates a real need for better access to historical rate and volume information.  

A reason for shippers wanting better access to historical results is found in the response to the question: 

“Do you feel railroads know more about your historical rates and carloads than you do?” 

55% of shippers answered YES!

This indicates that railroads frequently know more about how shippervolumes and rates have changed than shippers do. This represents a big problem for shippers. Your railroad knows how your rates and volumes have changed.  If past large rates increases are not addressed in current rate negotiations, this indicates one of two things: 

  • You have forgotten about the large rate increases of the past; or, 
  • Large rate increases are not causing you a problem. 

Either situation can be detrimental to a shipper’s rates. Silence is Not Your Friend! It does not send the proper message to a railroad. 

historical changes in rates and volumes - poll 2

Another interesting result is that 55% of the shippers answered that they do not have access to historical data that summarizes all the historical changes in their movements. This means that it is difficult for these shippers to demonstrate the problems that past rate increases are having on their current business. This also provides some context for why 83% of the shippers answered that better access to historical rates and volumes would improve their negotiations with railroads. This is what the Rail Cost Control (RCC) program’s Database Management System provides to shippers!

The webinar provided examples of the impact that historical changes in rates and volumes can have on your rate negotiations with railroads. To gain access to a recording of the webinar contact EC.

Another interesting response: Do you maintain historical bid rates for movements that did not win the award of carloads?

Only 33% answered YES!

It can be very helpful to know how much a railroad missed the award by in the last bidding cycle. Railroads always say that their bid rates reflect the current market. It is good to be able to point out how their rates have been above market rates in the past. This provides shippers more credibility when discussing the rates needed for railroads to be successful in the current bid solicitation. This is especially relevant if you are going to be proactively establishing rates for your movements with railroads by providing:

– The Rates you need,
-The Reason why you need them,
-And the Reason the railroad should give them to you.

historical changes in rates and volumes - Poll

In Escalation Consultants’ experience, negotiations with railroads dramatically improve, when you establish an informed narrative. 

This narrative refers to: the Rates you need, the Reason you need them, and the Reason the railroads should give them to you. Knowing how your rates have changed in the past, directly impacts the quality of your story. Leveraging this data dramatically improves your likelihood of obtaining better rates in the future. 

The source of this data was the first in a series of three webinars that will address industry trends, strategic planning, and specifically designed tactics shippers can use to improve their rail negotiations and decrease rail expenses.   

We hope you will join us again for Webinar #2 in May. This webinar will cover: Optimizing Your Spend on Each Railroad to Significantly Reduce Your Rail Expenses. 


Escalation Consultants, Inc. developed Rail Cost Control (“RCC”)  to help shippers reduce rail expenses by managing costs and empowering negotiations. Furthermore, for more information about RCC and other related articles, visit the RCC Blog.

Database Management System

Database Manager System

Generate Maximum Savings Through Optimizing

The blog titled Optimizing to Reduce Shippers Rail Expenses showed the process shippers can use to reduce rail expenses by millions of dollars while, at the same time, increasing railroad profit by millions of dollars. This value is created by optimizing railroads rates during a shippers bid evaluation. Win/Win opportunities are created by understanding the relationship between: 

The Reduction in Spend a Shipper Receives from Reduced Rates 

in Relation to 

the Increase in Profit the Railroad can Receive from Obtaining Additional Volumes 


The question that needs to be answered is how does a shipper determine the maximum value it can create through the optimizing process? Determining maximum value from optimizing is important as it brings the rate level of captive movements into rail negotiations. To do this a shipper needs to know the Pivot Point for awarding competitive carloads on each railroad.     

The Pivot Point represents the point where a railroad makes the maximum profit from reducing a shipper’s rates. 

Once the Pivot Point is reached, it becomes less attractive for a railroad to decrease rates to get the award of more competitive carloads. The Pivot Point shows when a rate reduction for the shipper is no longer offset by railroad profit obtained from an increase in carloads.

Illustration 1 demonstrates what goes into determining the Pivot Point. Illustration 1 shows that a 12% decrease in bid rates for a railroad’s competitive traffic is the Pivot Point. This decrease results in a 30% increase in the railroad’s profit resulting from a 20% increase in competitive carloads for the railroad. To get the most out of rail negotiations it is important for shippers to know the Pivot Point for rate reductions on each of their railroads. 

Rail Cost Control Pivot Point

Calculating the Pivot Point is an iterative process that continues to reduce rates on competitive movements for a railroad. With each rate reduction carloads are then re-award based on the lowest bids for competitive movements to determine the impact on both the railroad and the shipper. 

These changes are continually calculated until the Pivot Point is determined. Illustration 2 provides the results of this iterative process for the railroad used in our analysis. This graph shows the dollar savings for the shipper in relation to the change in rail profit for the railroad. These changes result from rate reductions of 1% to 18% in a railroad’s bid rates.

(Note to visually see the impact on rail profit and shipper savings, all dollar values are shown as positive amounts)

A 12% reduction in competitive rates represents the Pivot Point, as this generates the maximum amount of profit the railroad obtains from the award of more carloads. Railroad profit starts decreasing with rate reductions greater than 12%. Shipper’s savings continue to increase with rate reductions but by a 16% reduction the benefit to the shipper is greater than to the railroad. The source for Illustration 2 is the Rail Cost Control Program (RCC).

Rail Cost Control Pivot Point Optimized

Initially, the Pivot Point normally generates greater value for railroads than shippers.

This is because it represents the maximum increase in profit a railroad can get from reducing its rates. The table below demonstrates this as it summarizes the results for the rail bids used in this article.


Table 1

Summary Results for a 12% Rate Reduction on a Railroads Competitive Rates  

Shipper Savings 

$6.7 million 

Increase in Railroad Profit 

$12.5 million 

Increase in Railroad Revenue 

$23.0 million 

Increase in Railroad Carloads 

5,100 

**Table 1 Source: Output Table from the RCC – Cost Optimizer**

Table 1 shows that the railroad makes out much better than the shipper. The railroad makes $12.5 million in additional profit, while the shipper receives savings of $6.7 million. This difference brings rate reductions for captive movements into the optimizing process. Rates for captive movements become part of an iterative process that determines the best split of the benefits between the shipper and railroad through the optimizing process. The source for Table 1 is the Rail Cost Control Program.

Table 2 provides the results from optimizing after rate reductions for captive rates are included in the optimization process. This table shows the shippers expense is reduced by $9.6 million while the railroads profit is increased by $9.6 million. This is a good deal for the railroad as it makes $9.6 million more in profit and $20 million more in rail revenue than it would receive based on its initial bid rates. This is also a good deal for the shipper as its rail expenses are reduced by $9.6 million.

Table 2

Change from Bid Rates Summary Results After Captive Rates are Included in the Optimizing Process

Shipper Competitive Spend Saving

-$6,814,188

Shipper Captive Spend Savings

-$2,826,917

Shipper Total Savings

-$9,641,105

Railroad Competitive Profit

$12,556,031

Railroad Captive Profit

-$2,904,317

Increase in Total Railroad Profit

$9,651,714

Increase in Railroad Spend

$20,135,460

Increase in Railroad Carloads

$5,100

**Table 2 Source – Output Table from the RCC – Cost Optimizer**

When shippers are armed with opportunities created by optimizing rail expenses, they create value for themselves and their railroads. Shippers reduce the rate structure for their movements, while substantially improving profit and carloads for railroads.

The best negotiations are win/win negotiations and optimizing creates this type of negotiation. Therefore, the question is, why haven’t more shippers used optimization to reduce their rail expenses?  The answer is complexity and time constraints. This was the reason for the development of the Rail Cost Control (RCC) Program. The algorithms in the RCC’s Cost Optimizer automatically determine the Pivot Point for each railroad and the results to expect from the optimizing process, for both the shipper and railroad. This is a game changer for many companies.


For more information on optimizing rail expenses, check out the Rail Cost Optimizer. 

Escalation Consultants, Inc. developed Rail Cost Control (“RCC”)  to help shippers reduce rail expenses by managing costs and empowering negotiations. Furthermore, for more information about RCC and other related articles, visit the RCC Blog.

Rail Rate Checker Banner