Are Railroads Turning the Corner on Bad Service?
Much has been written about current problems with the United States supply chain. The problems are far ranging, but the primary focus has been on:
-
The backlog of ships at ports;
-
The breakdown of rail service at major ports, which is making it more difficult to clear docks; and,
-
Poor rail service for important Agricultural commodities like Grain and Fertilizer
To assess the current situation with service, this article takes a closer look at railroad’s overall performance of Intermodal, Unit Train, and Manifest traffic. Railroad operating results indicate that service problems are stabilizing on a large segment of rail traffic and the hope is that this is the start of an overall improvement in rail service.
Change in Carloads
Illustration 1 tracks the percent change in monthly Intermodal carloads versus Manifest carloads on the four major U.S. railroads between January 2019 (beginning of pandemic) and May 2022.
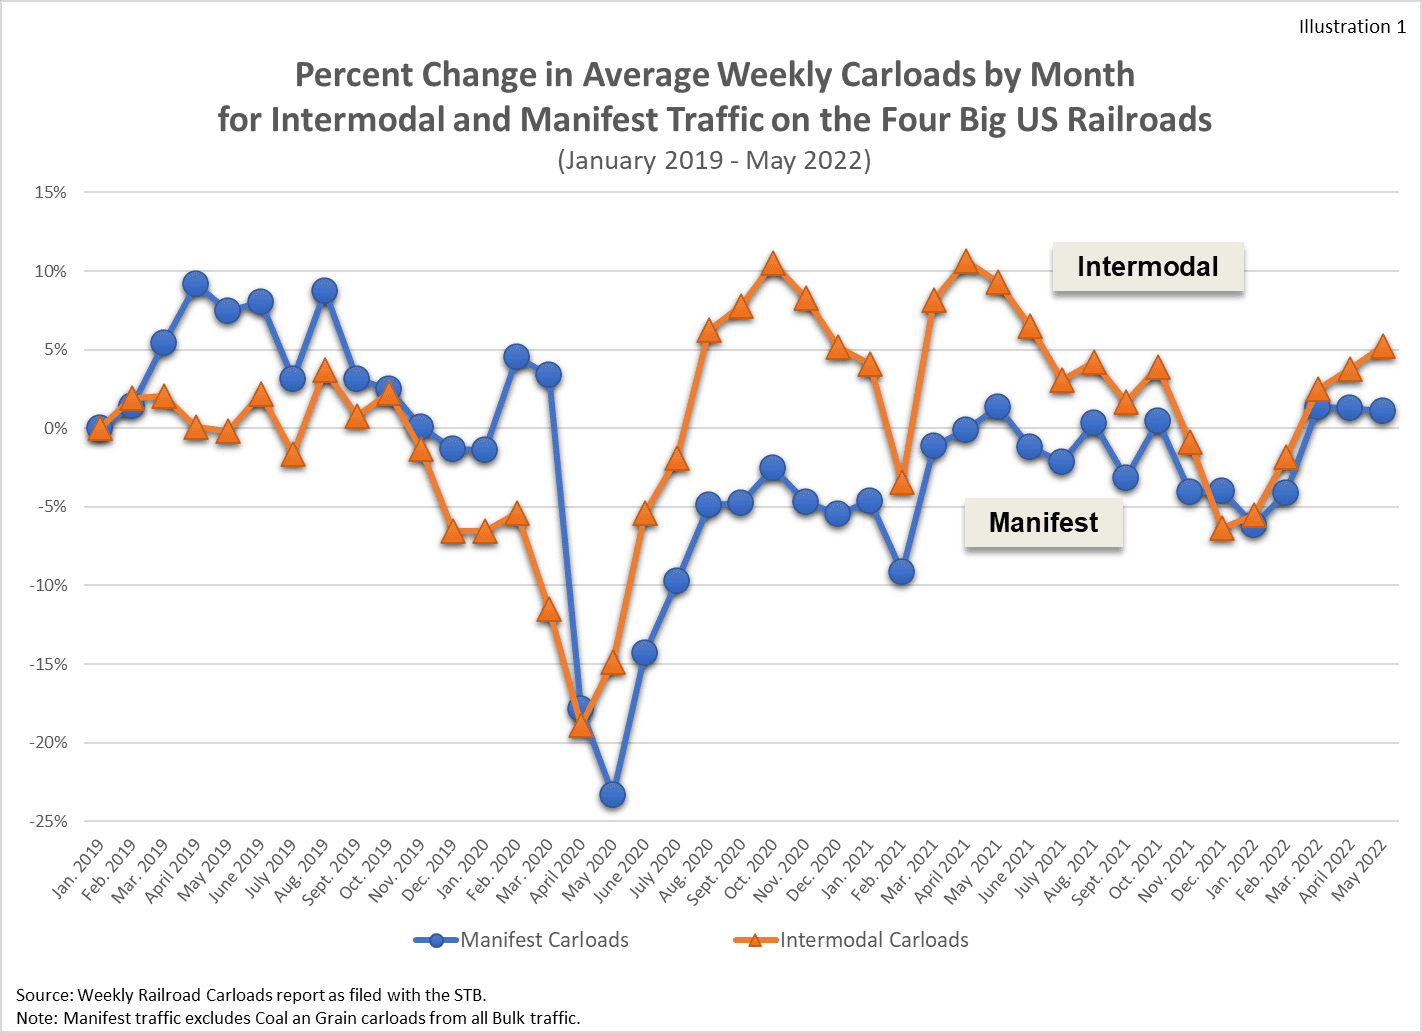
Illustration 1 shows that Intermodal carloads recovered more quickly than Manifest carloads from the height of the Covid pandemic in May 2020. Unlike Manifest traffic, Intermodal carloads exceeded pre-Covid levels in much of 2020 and 2021. However, by March 2022 Intermodal and Manifest carloads were both above pre-Covid levels.
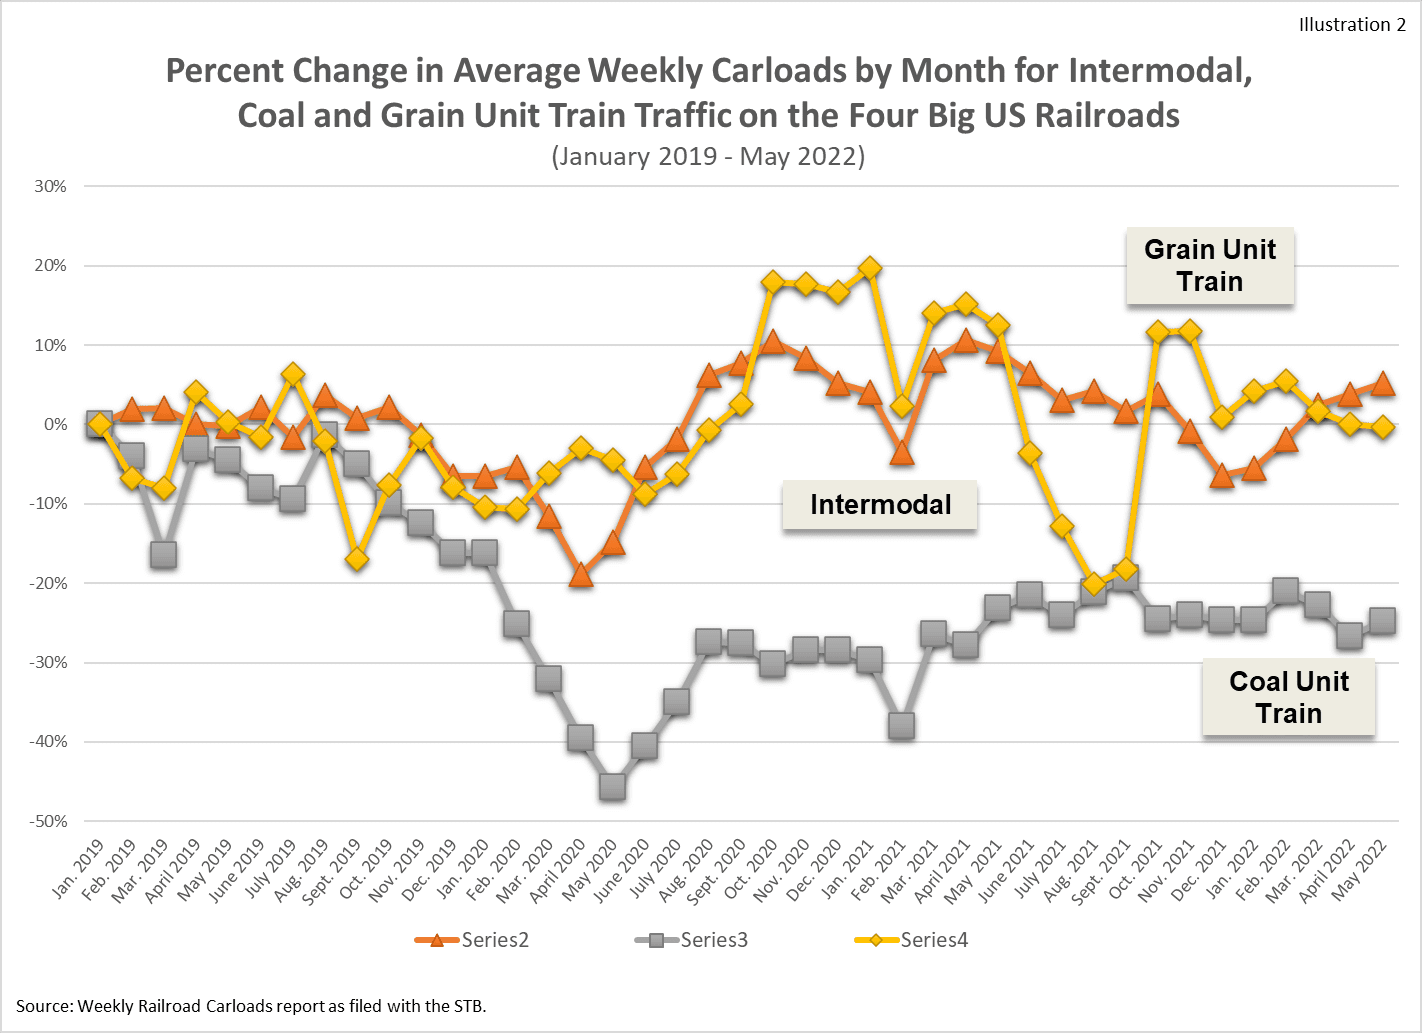
The percent change in carloads for Coal and Grain unit train movements are tracked against Intermodal carloads in Illustration 2. This shows that Grain carloads fluctuate more than Intermodal, but the cumulative percent change is approximately the same as carloads for Grain and Intermodal are both at pre-Covid levels. Coal carloads are down 20% to 30% for reasons that are not related to the Covid pandemic.
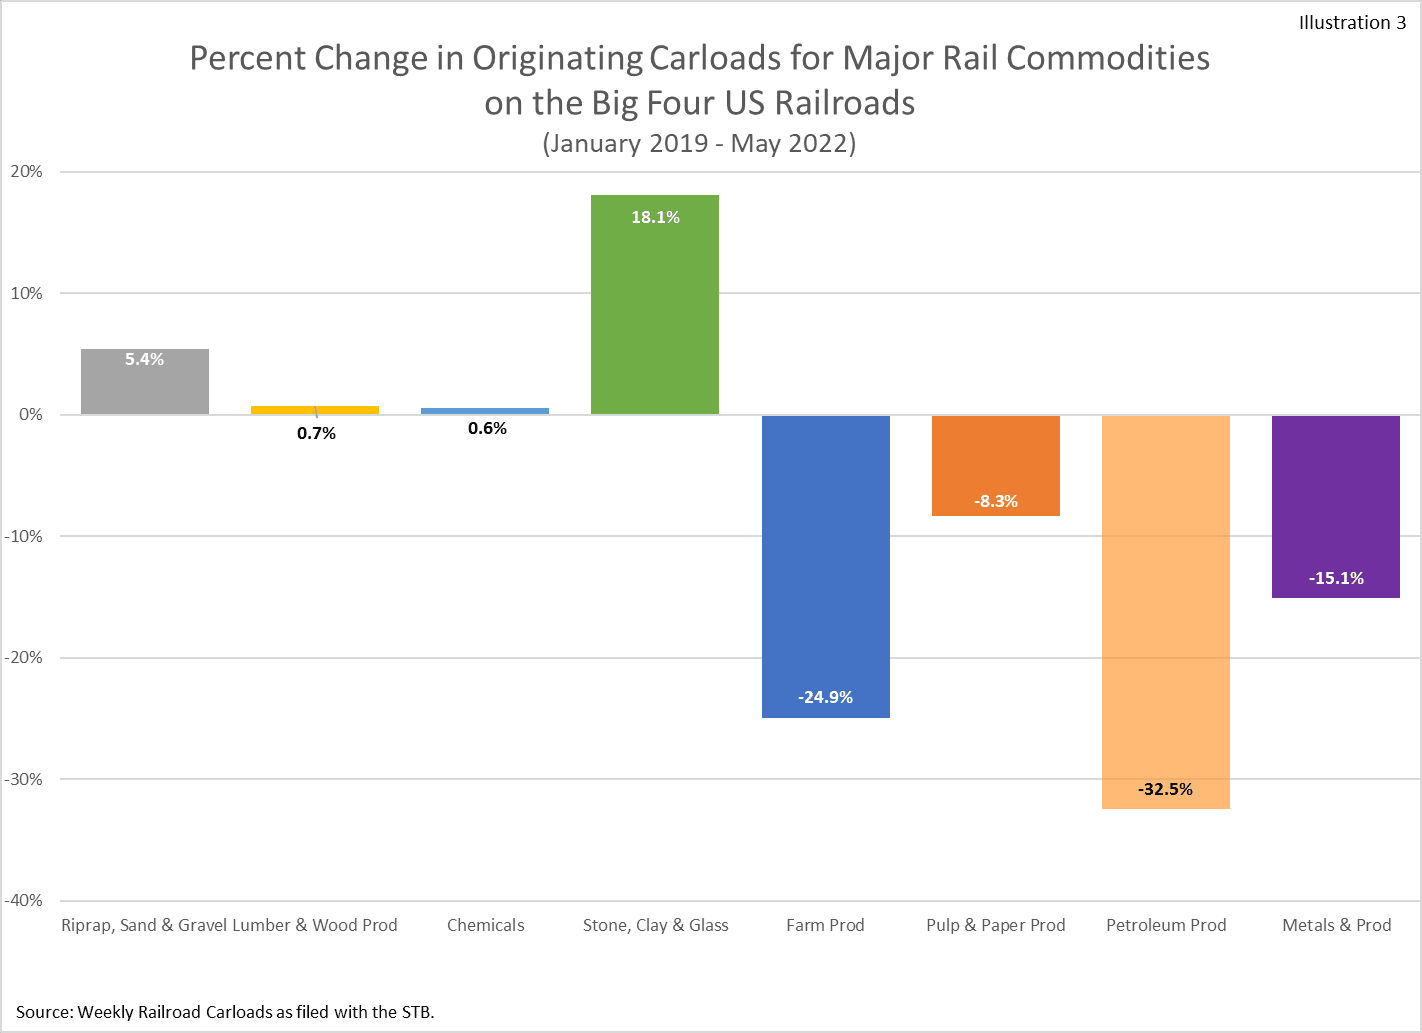
The cumulative change in carloads for other major rail commodities between January 2019 and May 2022 are in Illustration 3. The carload data indicates that service problems are unrelated to an increase in carloads on the rail system, as carloads currently reflect levels similar or below pre-Covid volumes.
Change in Train Speed and Dwell Time
Most rail traffic is moving slower now than before Covid had an impact on the U.S. economy. Intermodal traffic is doing significantly better than Manifest traffic as well as Coal and Grain Unit Train traffic as it is only slightly down from where it was in January 2019.
Illustration 4 shows that the average speed of all types of traffic, other than Intermodal, on the four major U.S. railroads has been in a steady decline since the second quarter of 2020.
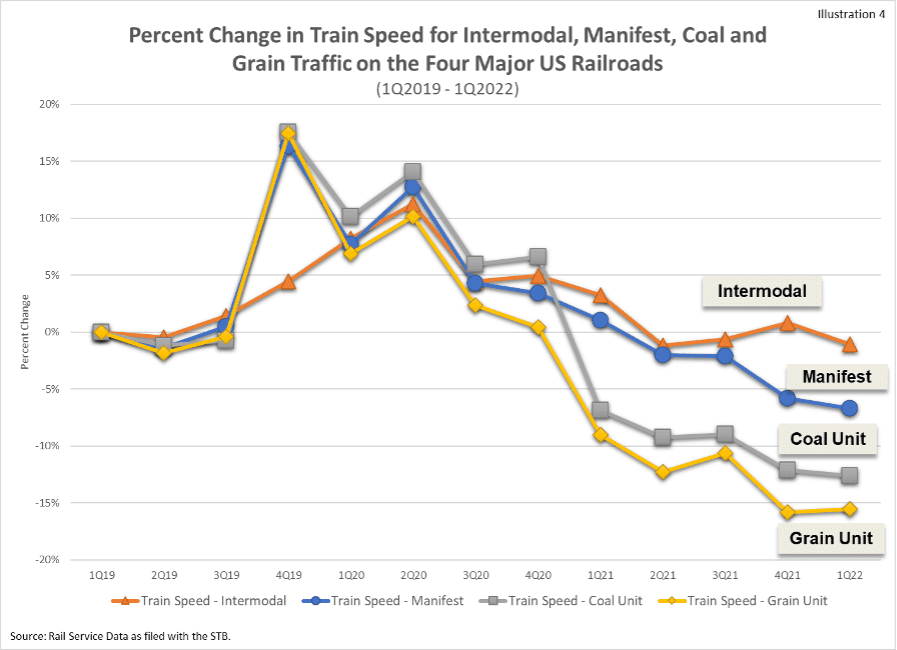
Intermodal Train Speed stopped decreasing in the second quarter of 2021, while the speed of Manifest traffic continued to decline.
Overall, the speed of Intermodal traffic is only down 1% since the first quarter of 2019, while the speed of Manifest traffic is down 7% due to a consistent drop in 2021 and 2022. Illustration 4 shows that the decrease in Train Speed is a more significant problem with Coal and Grain Unit Train movements.
Illustration 5 shows that as Manifest traffic Train Speed started to continually decrease in the second quarter of 2020, the Dwell Time of rail trains at rail terminals continued to increase. This is bad news for rail shippers as trains are spending more time delayed at rail terminals and when leaving the terminal, trains are moving at a slower speed. Illustration 5 shows that this problem has gotten continually worse since the second quarter of 2020. This problem is causing big delays in rail shipper’s deliveries to customers, and it is a significant contributor to the slowdown in the U.S. supply chain.
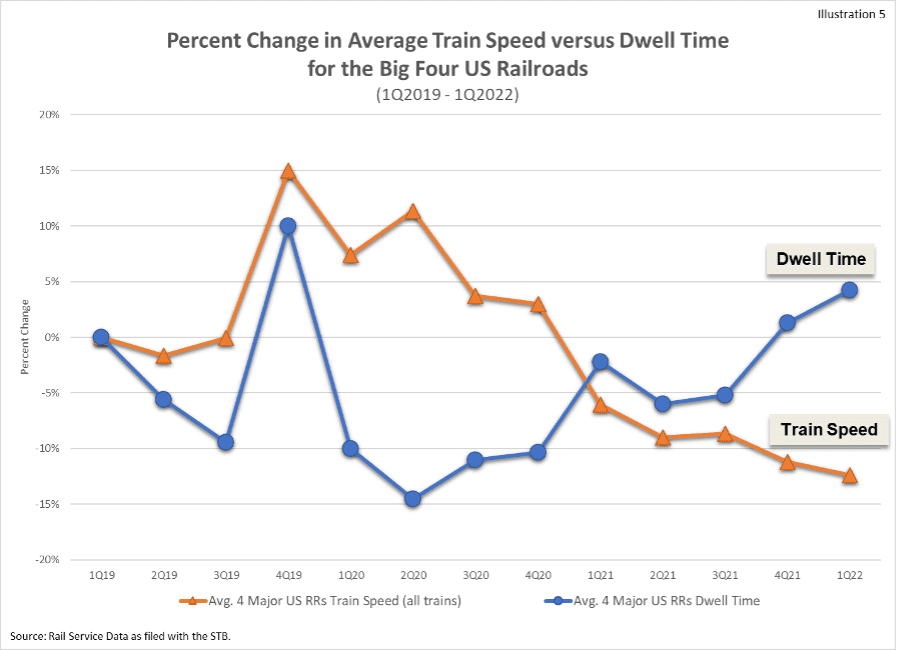
The one bright spot from this data is that service for Intermodal movements appears to be improving. The Train Speed for Intermodal has been relatively stable since the second quarter of 2021, while Intermodal carloads have had big up and down fluctuations. Intermodal represents a very large percent of all rail traffic, and the hope is that improvements in this area will have a ripple effect on the entire rail system.
Railroad submittals to the Surface Transportation Board (STB) are the source for the data in this report. Current and historical data on rail service, rates, and volumes by commodity and market area are available in the Rail Cost Control program.
