Impact of Consolidation on Freight Rail Rates
An analysis of railroad pricing practices shows that over the last fifteen years there has been a fundamental change in how railroads establish rates for movements. The analysis shows that rail movements with pricing considered potentially non-competitive by the Surface Transportation Board (STB) have become the norm and not the exception.
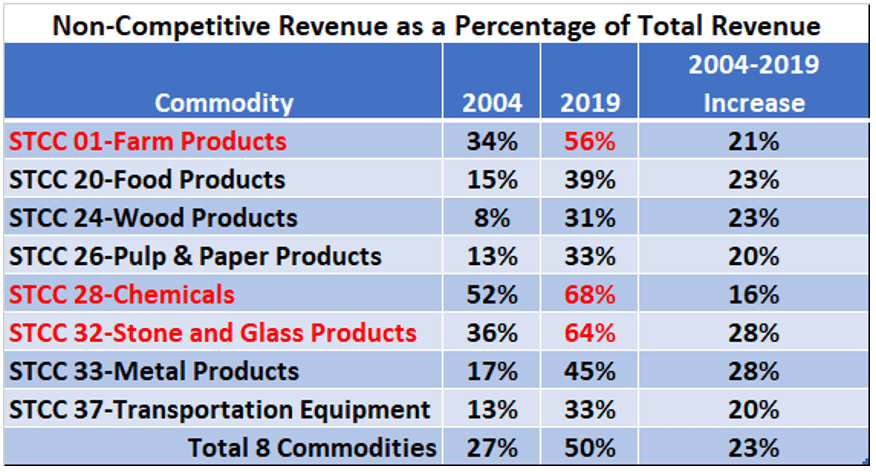
The analysis, performed by Escalation Consultants, for the Rail Customer Coalition, covers the change in railroad pricing for eight major commodity groups between 2004 and 2019. Table 1 shows these eight commodity groups. In the analysis, non-competitive pricing consists of revenue from rail moves with Revenue to Variable Cost Ratios (RVC’s) greater than the 180% RVC Regulatory Jurisdictional Threshold. Revenue from moves with RVC’s below 180% is considered competitive revenue.
(Table 1)

The analysis shows the following changes in railroad pricing practices between 2004 and 2019.
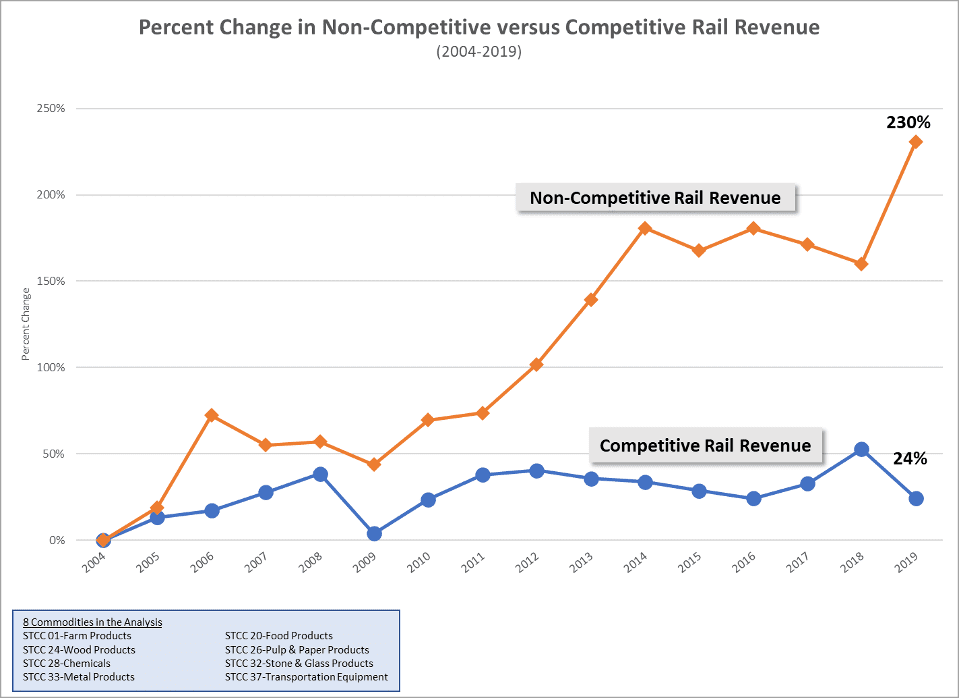
Revenue from rail moves with non-competitive pricing increased by an average of 230% over the last 15 years.
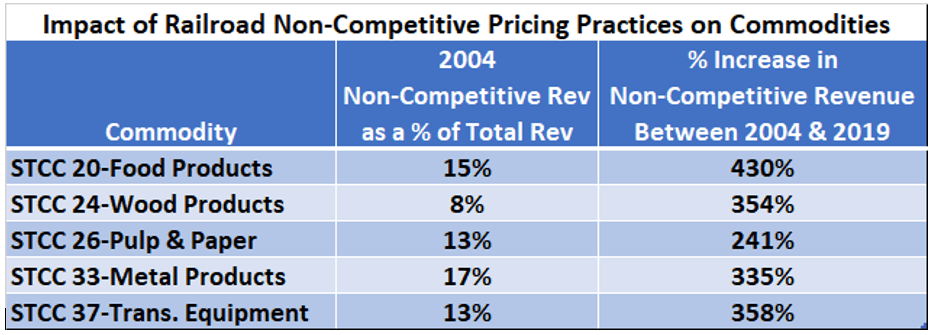
- Half the commodities had non-competitive pricing revenue increase by more than 300%.
- Commodity revenue from rail moves without non-competitive pricing either decreased, or had small increases over the last 15 years.
Moves with non-competitive pricing generated 50% of all 2019 railroad revenue (see Table 2).
- Chemical movements are most significantly impacted, as 68% of all Chemical revenue is generated from rail moves with non-competitive pricing.
- 64% of Stone and Cement revenue comes from non-competitive pricing
- 56% of Farm Products revenue comes from non-competitive pricing
- The percentage of total revenue from moves with non-competitive pricing increased by 23% over the last 15 years. While revenue from moves with competitive pricing decreased by 23%.
The large increase in non-competitive revenue caused the average RVC to increase from 134% to 165% between 2004 and 2019 for shipments of the eight commodities in the analysis.
Conclusions from Analysis
Illustration 1 shows the cumulative percent change in total non-competitive revenue and competitive revenue by year for these eight commodities. This shows that non-competitive revenue has consistently increased over time while competitive revenue has had little change. These historical changes indicate that the STB is regulating a very different rail industry today, than it regulated in 2004.
(Illustration 1)
Based upon the large increase in non-competitive revenue, it would be logical to expect a large number of rate cases before the STB. This has not happened!
Many shippers believe that the existing regulatory process is weighted too much in favor of railroads. The large increase in non-competitive revenue, shown in Illustration 1, supports this contention. Non-competitive revenue has increased 230% over the past 15 years. This indicates that railroads are not worried about regulatory pushback from generating non-competitive revenue from a large portion of their rail traffic.
The analysis shows that commodities are not impacted by a railroad’s non-competitive pricing practices to the same degree. Table 2 shows that 3 commodity groups had non-competitive revenue representing more than 50% of all rail revenue:
-
-
-
-
-
Chemicals – 68% of all revenue
-
Stone & Glass Products – 64% of all revenue
-
Farm Products – 56% of all revenue
-
-
-
-
These are very large commodity groups, and they have a significant impact on the total non-competitive revenue railroads make from their pricing practices. These commodity groups benefit the most from an improvement in regulations that impact rates.
(Table 2)

Table 3 shows the largest increase in non-competitive revenue occurred in commodities with the smallest percent of non-competitive revenue in 2004. Paper, Wood, Food, and Transportation Equipment commodities make up a relatively small percentage of total rail revenue under non-competitive pricing in 2004. These commodities now have around a third of all revenue subject to railroad non-competitive pricing. The analysis demonstrates that railroad’s non-competitive pricing practices are widespread and affect more movements now, than they did in 2004.
(Table 3)

Summary
The Rail Pricing Analysis indicates that railroad pricing practices have changed dramatically over the last 15 years. It also indicates that rail rate regulations have not kept pace with these changes. The 230% average increase in non-competitive revenue indicates that railroads do not appear to be particularly worried about existing rate regulations.
If the pattern of change over the last 15 years continues, the majority of rail traffic will move under rates that generate non-competitive revenue for railroads. To change this, the potential for winning a rate case before the STB will need to be more favorable to shippers than it has been over the last 15 years. This will likely require a more effective and less expensive method to challenge non-competitive rail rates.
Consolidation within the Transportation Industry is facing additional scrutiny as regulators contemplate additional rail mergers. Mergers that could have further negative impact on the competitive landscape and the affordability of shipping US goods by rail. This analysis indicates that regulators need to carefully consider the changes needed to the regulatory system to protect shippers from the impact of a smaller number of railroads competing for their business.
Note – The STB Commodity Revenue Stratification Reports are the source for all data used in the Analysis of Railroad Pricing Practices.
Escalation Consultants, Inc. developed the Rail Cost Control (“RCC”) program to help shippers reduce rail expenses by managing costs and empowering negotiations. For more information about RCC and other related articles, visit the RCC Blog.


