• RCC Solutions
    • AXIS
    • Rail Rate Checker
    • Cost Optimizer
    • DMS
  • Resources
    • News & Events
    • Seminars & Training
  • Company
    • About Us
    • Contact Us
  • Login
  • Menu Menu

Tag Archive for: Rail Rates

Posts

Rail Rate Benchmarking

Use Competitor Rates to Reduce Your Rates

March 3, 2021

Railroads do not mind a shipper saying they have high rates. What does have an impact is showing that a railroad’s rates are putting you at a competitive disadvantage in your markets.

What this means is, in order for a shipper to have reasonable rates, it needs to know something about its competitors’ rates.

Fortunately, obtaining information on competitors’ rail rates is easier than many shippers realize. Railroads are required to submit a large amount of data on their moves to the Surface Transportation Board (STB). This data contains costs, rates, volumes, and profit which helps shippers become more knowledgeable about the rates they compete against in their markets.

Two primary methods for benchmarking a shipper’s rates against competitors:

1) Public Use Carload Waybill Statistics (Waybill)

The Waybill is a large database, containing information on over 700,000 rail movements with detail down to the five-digit STCC. The Waybill provides information on where volumes going into a market originate. It also provides the rate levels moving the volumes.

2) Cost and Profit Benchmark Rates

Benchmarking shows the rate that gives the railroad the average profit received from all movements of your commodity on the whole rail system. No shipper wants to have above average rates which make this an important benchmark to understand. This benchmark rate is calculated using data railroads submit to the STB and is determined separately for captive and competitive moves as they have different levels of profit.

To get reasonable rates you first need to know what reasonable rates are. Railroads thrive on a lack of rate transparency which means it is up to the shipper to provide that transparency. Rate benchmarking provides ammunition that helps protect rail shippers from excessive rates from railroads that hold monopoly power over their traffic.

Railroads react differently to you saying you have high rates than they do to you showing that their rates are putting you at a competitive disadvantage in markets. If you can show railroads where their rates are putting you at a competitive disadvantage you will have much better success in rail negotiations. In addition, if you can show that high rates are causing both you and your railroad to lose volume in markets, you can accomplish a lot with your railroads. This all starts with rate benchmarking.

The types of rate benchmarks described above are automatically calculated for individual moves or on a macro basis in the Rail Cost Control program (RCC). Click on the link to learn more about the RCC.


Rail Cost Control (“RCC”) is a program developed by Escalation Consultants, Inc. to help shippers reduce rail expenses by managing costs and empowering negotiations. For more information about RCC and other related articles, visit the RCC Blog.”


Rail Cost Control

https://www.railcostcontrol.com/wp-content/uploads/two_men_discuss_financial_trends.jpg 674 800 Keith Nestman https://www.railcostcontrol.com/wp-content/uploads/new-logo-2.svg Keith Nestman2021-03-03 10:00:282021-06-01 13:52:26Use Competitor Rates to Reduce Your Rates
US Rail Station Captivity Map

Making Your Moves More Important to Railroads

February 24, 2021

The Rail Station Captivity Map

A basic rule to follow in getting more attention to your issues from railroads:

If you have the ear of people that are important to your railroads, then you make your moves more important to railroads.

Politicians have a big influence on railroads and can have a very positive impact on shipper’s rail negotiations. Politicians are also easy to access as they want to talk to shippers for self-serving reasons. Obtaining political support for your position in rail negotiations costs very little to pursue and can yield a positive return. The Rail Station Captivity Map was developed by Escalation Consultants to support discussions with politicians on railroad issues.

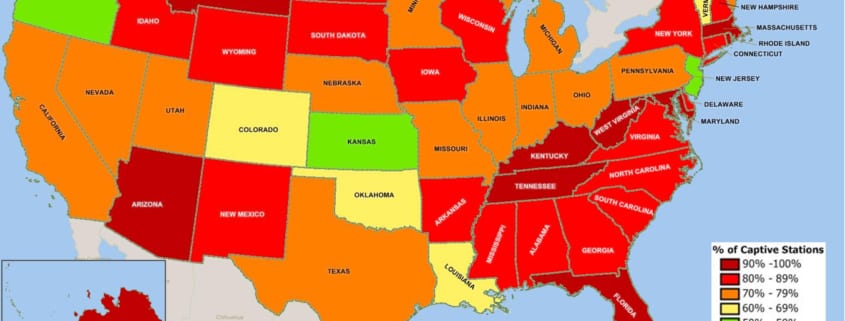
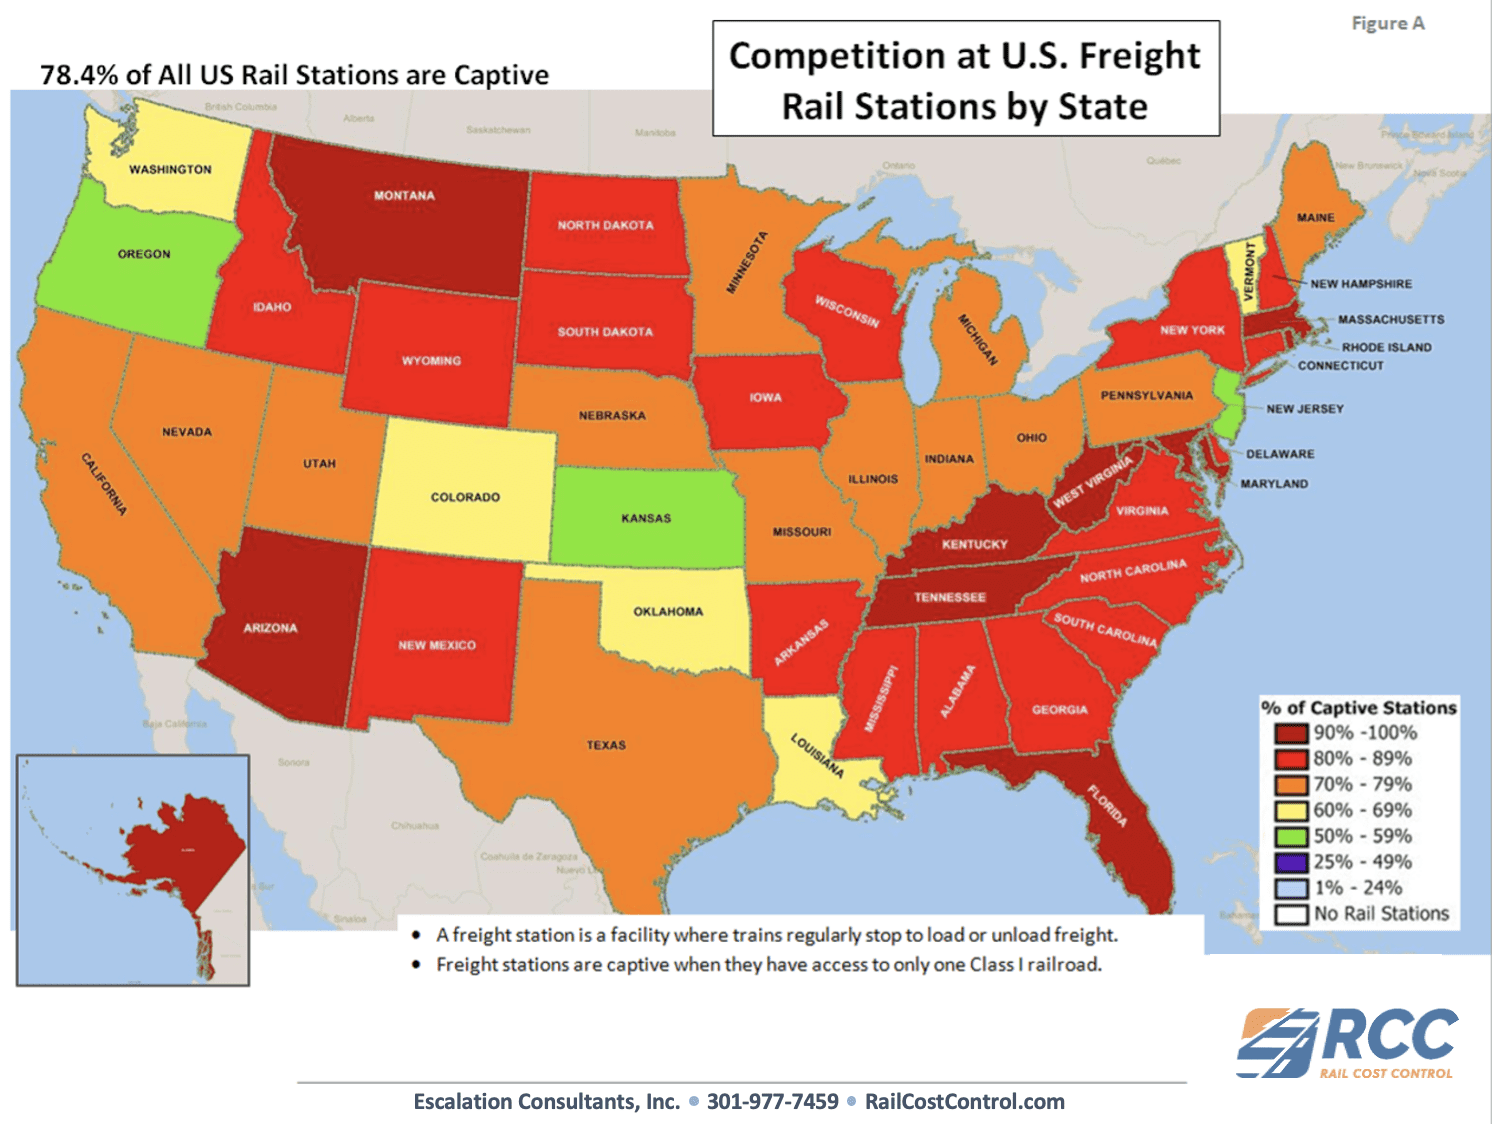
The Rail Station Captivity Map shows that 78.4% of all rail stations in the United States are captive to one Class I Railroad.

Figure A is color coded to show the percentage of all rail stations by state, that are captive to a single Class I railroad. Rail stations are captive if they don’t have either direct or indirect access, through a short line, to more than one Class I Railroad.

Making your movements more important to your railroads, USA


The number of states in each captivity range are shown below.

Breakdown of Rail Station Captivity in the US

# of States
% of Stations Captive to One Major Railroad
10 90% – 100%
18 80% – 89%
13 70% – 79%
5 60% – 69%
3 50% – 59%
0 25% – 49%
0 1% – 24%
Note: Hawaii is not included.

Railroads are always concerned about politicians, as they can have a significant impact on how railroads are allowed to operate. Unfortunately for railroad customers, it is frequently difficult to get the attention of politicians on rail rate issues. This is because the problems shippers experience with railroads are complex and not easy to explain.

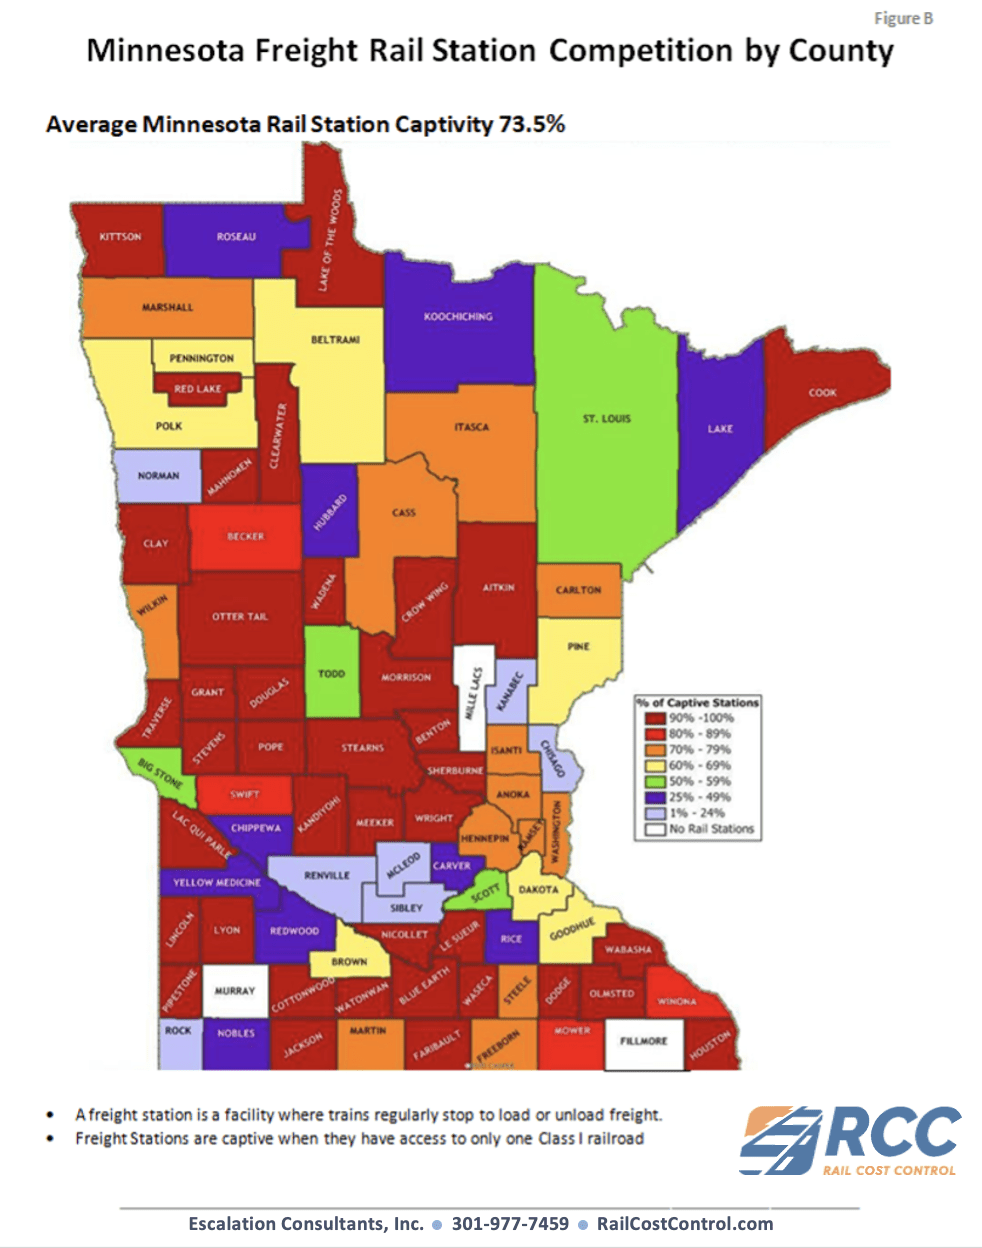
It is easier to get a politician’s attention with an easy-to-understand picture, highlighting the importance of rail to specific areas they represent. Figure B shows this as it contains the rail station captivity by County for the state of Minnesota. Rail Station Captivity Maps are available, by county and Congressional District, for all states in the United States.

Making your movements more important to your railroads MN.

Escalation Consultants is making state maps available for rail shippers. Simply contact Escalation Consultants to request the Rail Station Captivity Map for your states of interest.  

The State Rail Station Captivity Maps are effective at getting the attention you need to help resolve problems. When shippers want to make movements more important to railroads, getting the attention of Congressmen and Senators is a good way of accomplishing this. Please note: all politicians do not have the same amount of sway over railroads. In addition, there is a right way and a wrong way to deal with politicians. This needs to be understood, and allowed for, in your discussions with politicians.

Rail Station Captivity Maps, for a specific area, are an excellent way of showing railroads and politicians why production will not increase, and capital investment will not be made at an existing location that is captive to one Class I railroad. Captivity maps illustrate areas that will have difficulty in achieving economic development from companies that rely on rail freight.

Shippers need to be able to show that railroads’ monopoly power over captive movements at a facility creates problems for both politicians and railroads.

Rail Station Captivity Maps are proof of the expression: “A picture is worth a thousand words.” Shippers are encouraged to use these maps to increase their leverage in rail negotiations.


Rail Cost Control (“RCC”) is a program developed by Escalation Consultants, Inc. to help shippers reduce rail expenses by managing costs and empowering negotiations. For more information about RCC and other related articles, visit the RCC Blog.”

Rail Cost Control

https://www.railcostcontrol.com/wp-content/uploads/US-Rail-Station-Captivity-Map.bmp 843 1354 Keith Nestman https://www.railcostcontrol.com/wp-content/uploads/new-logo-2.svg Keith Nestman2021-02-24 08:00:052021-04-07 19:39:40Making Your Moves More Important to Railroads
analytical data chart and graph

Most Rail Rates Increase Less Than 2% Annually

December 16, 2020

Longer term rail contracts are now the norm. The question is:

What level of rate increase should a shipper agree to in a long-term rail contract?

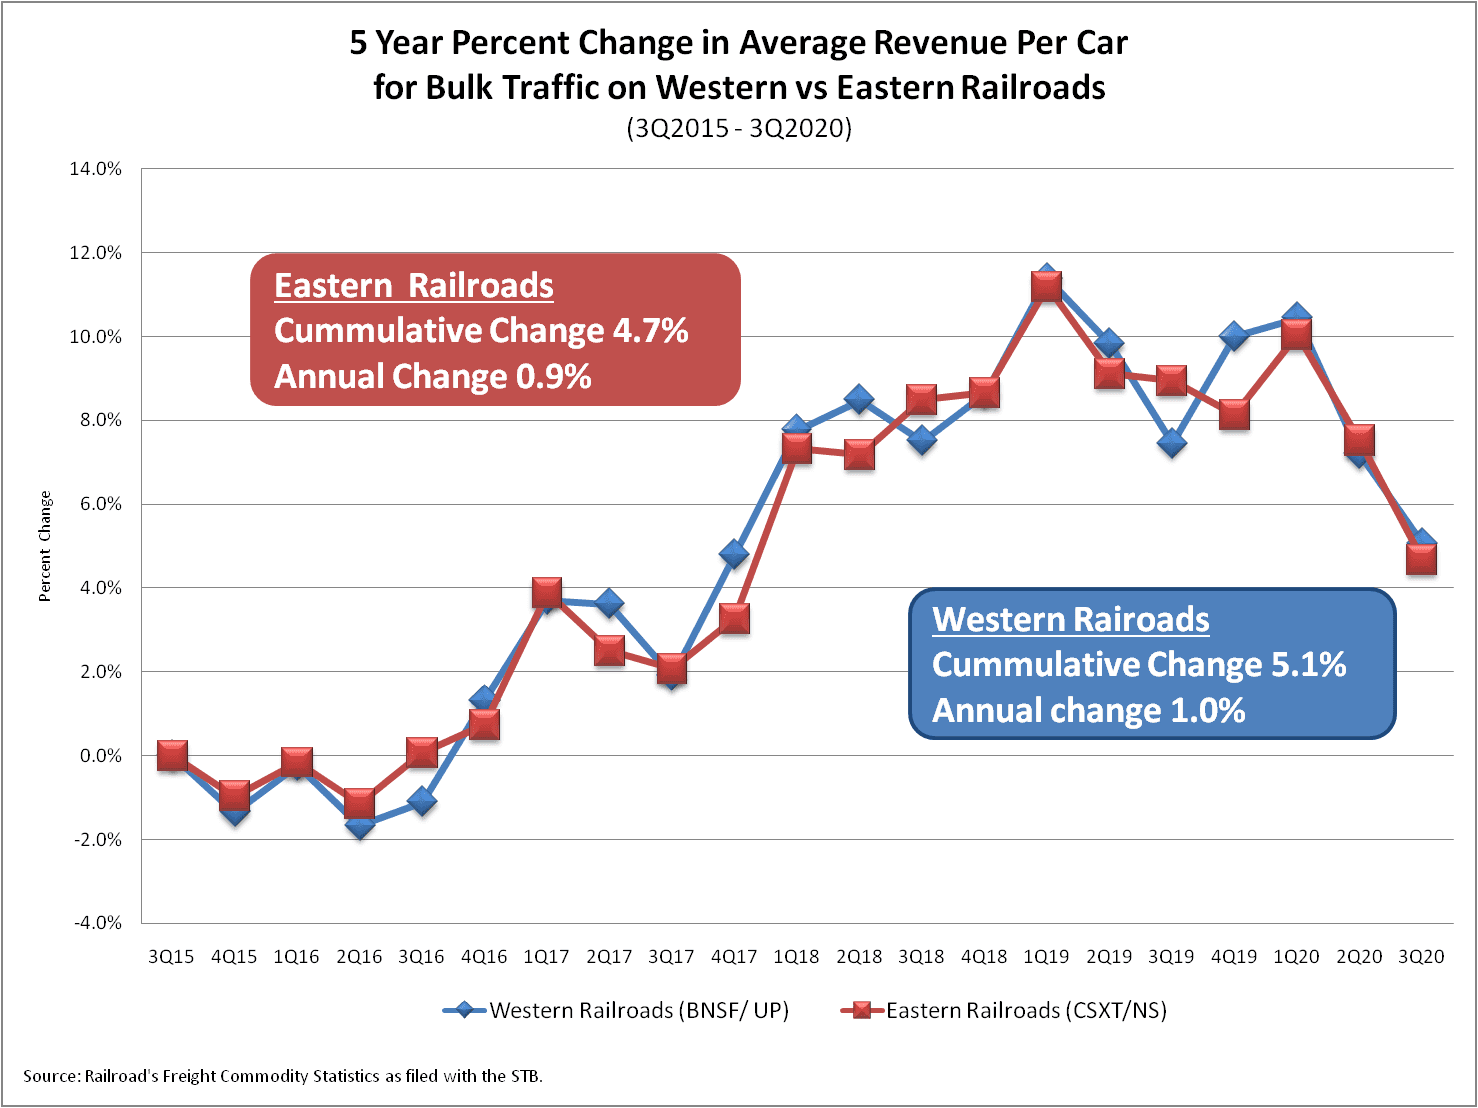
The graph below ultimately answers this question.

This graph shows that over the last 5 years rail rates for bulk rail movements had a cumulative increase of 5.1% on Western U.S. railroads, and 4.7% on Eastern U.S. railroads. This represents an average annual increase of 1.0% on Western U.S. railroads, and 0.9% on Eastern U.S. railroads.

Average Revenue Per Car for Bulk Rail TrafficBased on historical changes, a contract escalation rate greater than 2% puts a shipper at a competitive disadvantage in its markets. 

The graph above shows that the average rate per carload for bulk rail traffic been increasing less than 2% annually. In addition, bulk rail freight rates have plummeted in 2020, causing more shippers to reconsider the proper term for their contracts. Shorter term agreements, which take advantage of weakness in rail markets are being considered. 

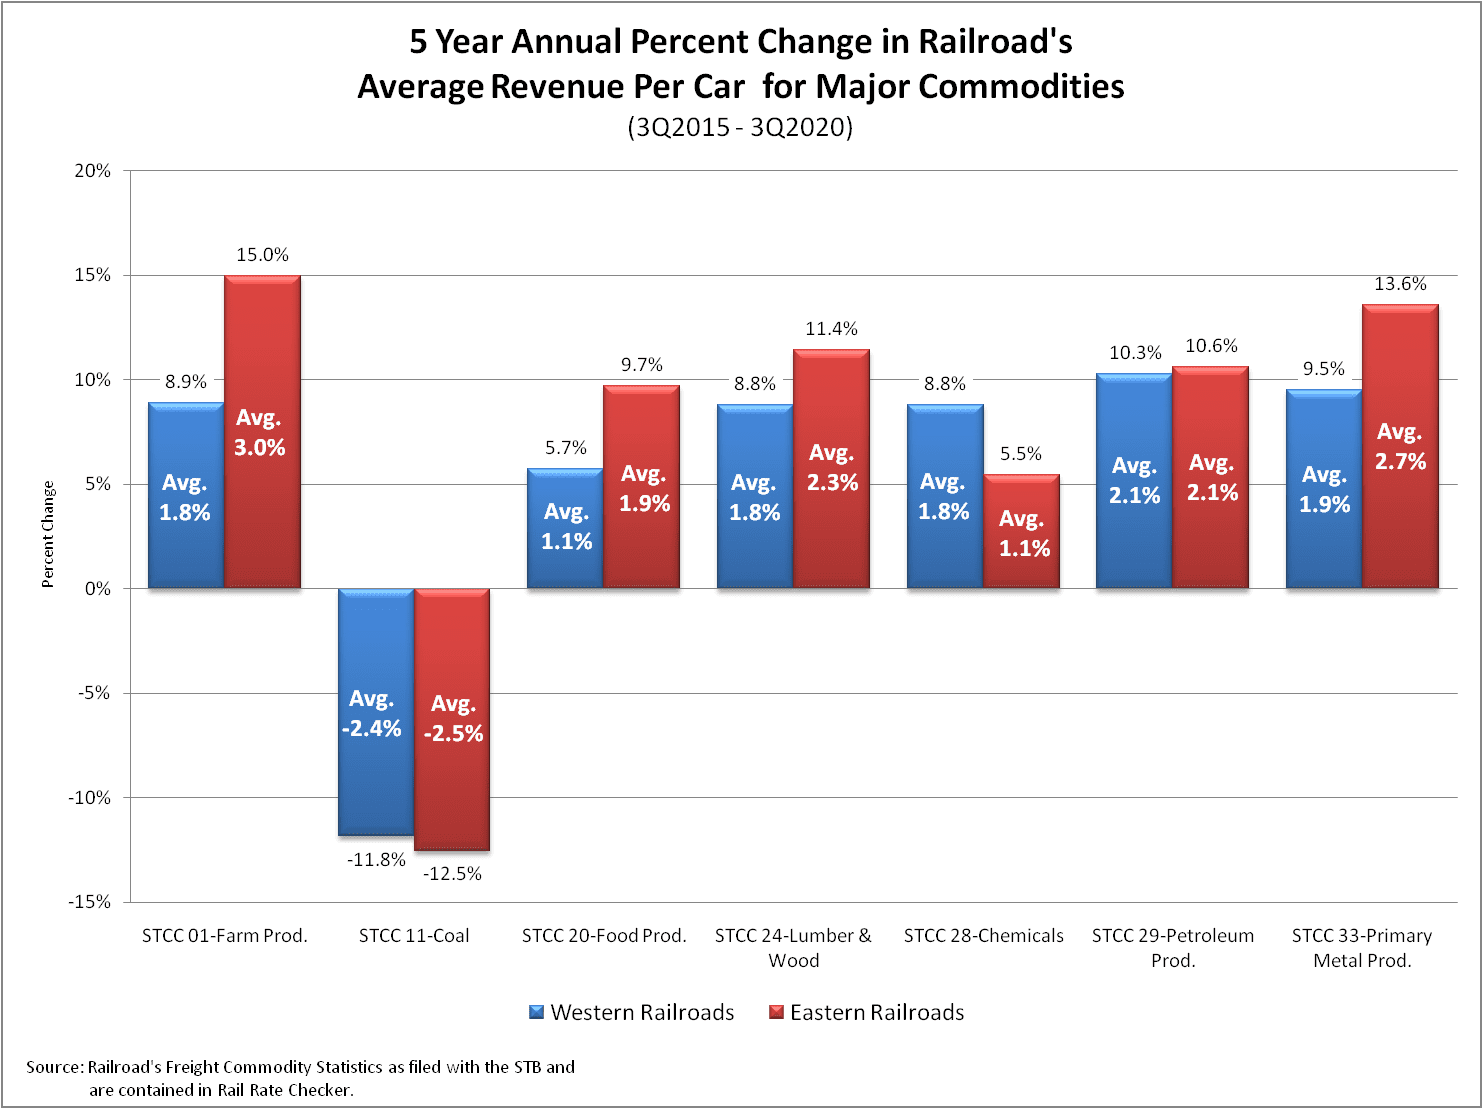
The graph below provides the 5 year trailing average rate of change for rail movements at the 2-digit STCC level for Eastern and Western railroads. Of the 14 rate changes in this graph, five (36%) increased more than 2% annually. While, only one (Farm Products) had an annual increase as high as 3%.

Annual Percent Change in Railroad's Average Revenue per Car

Due to the monopoly power that railroads have over many of their customer movements, they are required to submit a large amount of rate and volume information to the STB. Shippers need to access this data in order to be more proactive in rate negotiations with railroads.

Railroads rates and rate changes, down to the 5-digit STCC Code, are contained in Rail Rate Checker which is part of the Rail Cost Control system.


Rail Cost Control (“RCC”) is a program developed by Escalation Consultants to help shippers reduce rail expenses by managing costs and empowering negotiations. For more information about RCC and other related articles, visit the RCC Blog.

Rail Cost Control

https://www.railcostcontrol.com/wp-content/uploads/img_versus_competitors.jpg 851 1800 Keith Nestman https://www.railcostcontrol.com/wp-content/uploads/new-logo-2.svg Keith Nestman2020-12-16 14:39:032021-06-01 14:02:55Most Rail Rates Increase Less Than 2% Annually

Pages

  • About Us
  • AXIS
  • Contact Us
  • Cost Optimizer
  • Database Management System
  • Evaluation Exercise Calendly
  • Evaluation Exercise Contact Form
  • Home
  • Landing Page – 2025
  • Movement Evaluation Exercise
  • News & Events
  • PopUp Testing 05172021
  • Privacy Policy
  • Rail Rate Checker
  • Seminars and Training
  • Video Landing Page – 2025
  • YT

Categories

  • Uncategorized

Archive

  • October 2025
  • September 2025
  • July 2025
  • June 2025
  • November 2024
  • October 2024
  • June 2024
  • February 2024
  • September 2023
  • August 2023
  • July 2023
  • June 2023
  • February 2023
  • January 2023
  • June 2022
  • February 2022
  • January 2022
  • December 2021
  • October 2021
  • August 2021
  • July 2021
  • June 2021
  • May 2021
  • April 2021
  • March 2021
  • February 2021
  • January 2021
  • December 2020

Escalation Consultants has been serving railroad customers since 1979.

The Rail Cost Control Program is an Escalation Consultants Inc. product. For the last 40 years Escalation Consultants has assisted companies in reducing the delivered cost of their products. We are normally involved with large and small rail shippers in reducing rail expenses on more than a billion dollars in rail spend annually.

Escalation Consultants has spent decades developing tools that automatically seek out and quantify opportunities for reducing rail expenses. The RCC contains these tools and they allow you to look at your movements differently in order to create more cost-effective negotiations with railroads.

To learn about Escalation Consultants Inc, more visit www.EscalationConsultants.com

Quick Links

  • AXIS
  • Rail Rate Checker
  • Cost Optimizer
  • Database Management System
  • News & Events
  • Seminars & Training
  • About Us
  • Contact Us
  • Login

Contact Info

4 Professional Drive, Suite 129
Gaithersburg, MD 20879

info@railcostcontrol.com
301-977-7459 

linkedinfacebook

© 2025 Rail Cost Control. All Rights Reserved.

Scroll to top