• RCC Solutions
    • AXIS
    • Rail Rate Checker
    • Cost Optimizer
    • DMS
  • Resources
    • News & Events
    • Seminars & Training
  • Company
    • About Us
    • Contact Us
  • Login
  • Menu Menu

Tag Archive for: STB

Posts

RCC Blog - Improving Rail Rates on Captive Movements

A Regulatory Perspective: Improving Rail Rates on Captive Movements

July 11, 2023

Improving Rail Rates on Captive Movements

Large increases in railroad’s profitability are improving shipper’s leverage in rate negotiations on captive movements. This is happening because high levels of railroad profit are factored into the RSAM[1] data that the STB uses to determine the outcome of a 3-Benchmark Rate Challenge. Higher railroad profits result in the RSAM data improving the ability for a shipper to win a 3-Benchmark Rate Challenge. This strengthens negotiation leverage on captive movements. 

As an example, based upon the latest RSAM data, a rail shipper’s captive rates could be similar to competitor. However, they would be considered more than 25% above competitors’ rates in a 3-Benchmark Rate Challenge. This will be a big deal for many rail shippers.  

This blog is not intended to make you an expert on the calculation of the STB RSAM data or on everything that goes into a 3-Benchmark Rate Challenger. The intent of this blog is to provide: 

  1. A general understanding of how the 3-Benchmarks are calculated; 
  1. The impact high railroad profits can have on a shipper’s chance of success in a rate challenge; and, 
  1. The potential change in a shipper’s negotiation leverage on captive rail movements is due to the large increase in railroad profitability.  

Calculating the 3-Benchmarks 

The following benchmarks are used in a 3-Benchmark Rate Challenge. The STB calculates the values for Benchmarks 1 and 2. Shippers and railroads each calculate the 3rd Benchmark. 

Benchmark 1 – RSAM (Revenue Shortfall Allocation Mark-up Ratio) 

  • RSAM represents the average Revenue to Variable Cost Ratio (RVC) a railroad would need to generate from its rates on all captive traffic (traffic with RVC’s above 180%) to be revenue adequate. 

Benchmark 2 – RVC>180% 

  • RVC>180% represents the average RVC a railroad obtains from the rates for all of its captive traffic (traffic with RVC’s above 180%) 

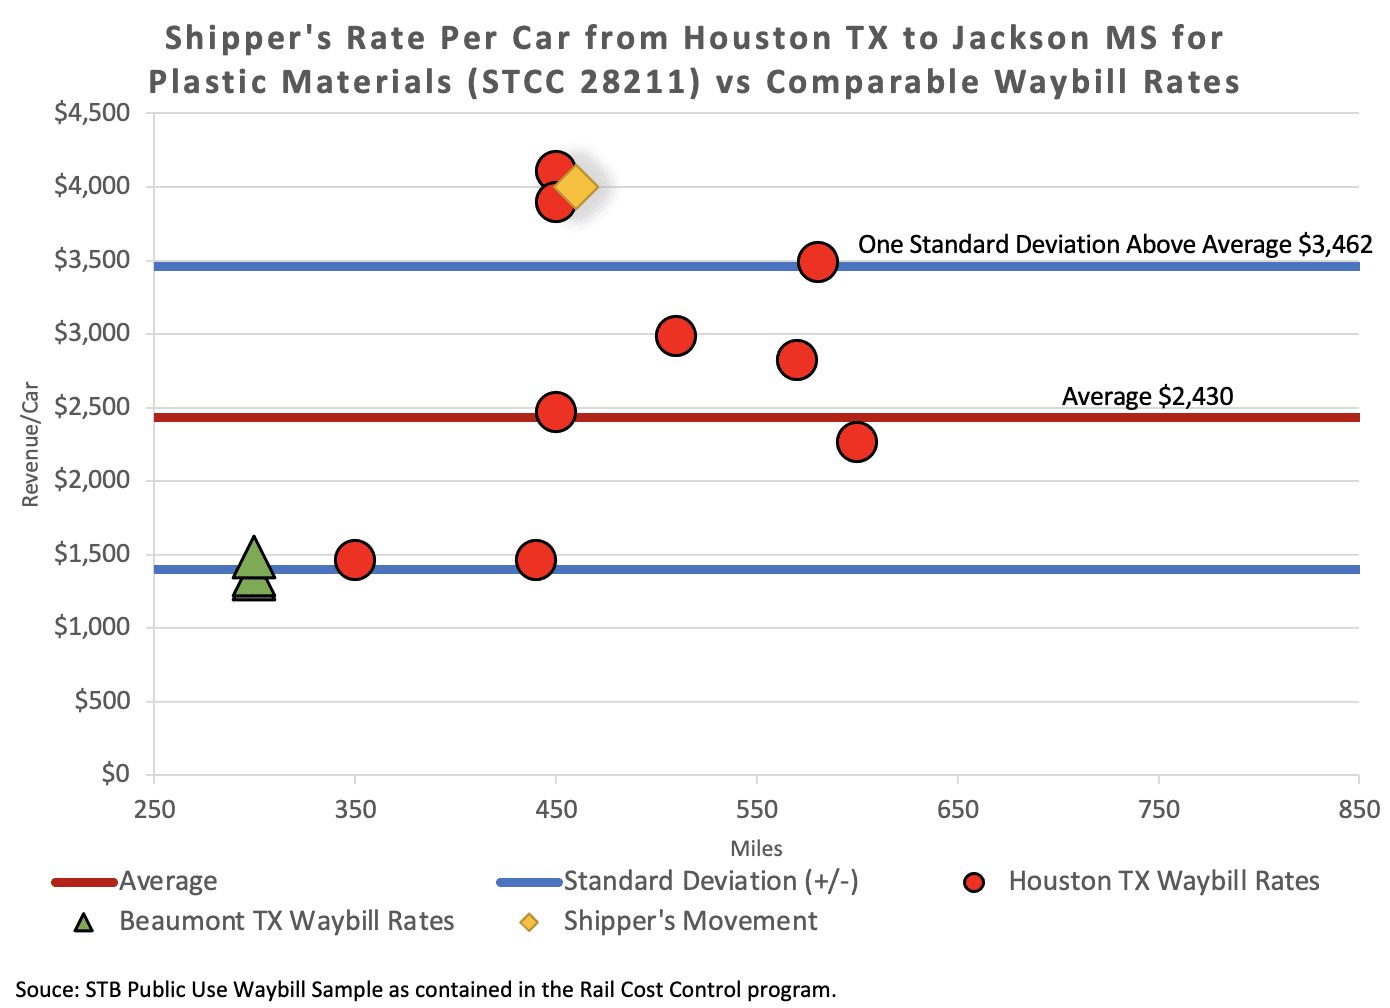
Benchmark 3 – RVC-Comp 

  • RVC-Comp is the average RVC for movement rates that are comparable to the rate for the contested movement.[2]  

Importance of Recent Change in RSAM Values on Shippers Chance of Success in a Rate Challenge  

The latest RSAM data substantially improves a shipper’s ability to win a 3-Benchmark Rate Challenge. This is because the recent increases in railroad profitability put significant downward pressure on railroads’ RSAM values and significant upward pressure on its RVC  > 180% value. Thus, your rates could be comparable to competitors, but be considered 25% above these rates in a 3-Benchmark Rate Challenge. 


To be clear, shippers don’t necessarily need to initiate a 3-Benchmark Rate Challenge at the STB. However, shippers do need to understand that a railroad now has more to lose by not listening to a shipper’s concerns about rates and service on moves where there is a lack of rail competition. 

Schedule a quick discovery call to learn how to best navigate these recent increases in railroad profitability & changes in RSAM Values.


[1] RSAM is Revenue Shortfall Allocation Markup Ratio calculated each year by the STB.

[2] Comparable movement rates must have RVC’s above 180%.

https://www.railcostcontrol.com/wp-content/uploads/Rail-Negotiation-Seminar-Survey-Tile-39.png 540 540 Keith Nestman https://www.railcostcontrol.com/wp-content/uploads/new-logo-2.svg Keith Nestman2023-07-11 09:00:292024-12-05 14:53:11A Regulatory Perspective: Improving Rail Rates on Captive Movements
STB Rate Case Index Study Rebuttal

The STB Study Saga Continues

February 28, 2022

Escalation Consultants, Inc.

The STB Study Saga Continues

An article was recently published by Railway Age. This article contains an exchange between Jay Roman, Founder and President of Escalation Consultants, Inc., and Dr. William Huneke, former Director and Chief Economist at the STB, on the STB’s Annual Rail Rate Index Study (STB Study).

The dialog that the article contains is of significant importance to all rail shippers as it highlights a need for a change in how the STB operates and the lens in which interested parties would utilize its data.

It is important to raise questions about the STB Study, because it will likely be used by lobbyists, politicians, and railroads to show that there are no major problems with rail rates. This may not be the STB’s purpose for the Study, but this is likely how companies that benefit from railroads ability to continually increase rates will use the findings in the Study.  In other words, if rates are “reasonable” there is no need to change STB regulations to have a more effective process for shippers to challenge rates.

The following link will take you to the Railway Age article.

STB Rate Index Study Rebuttal

We encourage you to forward this email, or share the article, with your teams and fellow rail shippers. 


Please contact us directly if you have questions or would like more information on the article: Info@RailCostControl.com


Rail Negotiation Seminar

https://www.railcostcontrol.com/wp-content/uploads/Copy-of-RCC-Rule-11-List-B-Instagram-Post-1080-×-1080-px.png 1080 1080 Keith Nestman https://www.railcostcontrol.com/wp-content/uploads/new-logo-2.svg Keith Nestman2022-02-28 08:00:082022-02-28 16:57:59The STB Study Saga Continues
RCC Blog - Uploads to STB's Carload Waybill Sample

Updates to STB’s Carload Waybill Sample

April 28, 2021

Big improvements Coming to the STB’s Carload Waybill Sample

The best source for understanding railroad rates and volumes for commodities into specific markets is the STB’s Public Use Waybill Sample (Waybill). The Waybill contains information that can significantly impact a shipper’s rail negotiations. It can also positively impact decisions made in shipper’s marketing and sales departments. Improvements made to Waybill data are, therefore, important for shippers to understand.

There are two big improvements in the Waybill data for merchandise traffic that shippers must be aware of. The first improvement will go into effect later in 2021 or early 2022. The second improvement is still being studied by the STB.

Waybill Improvement 1

The upcoming 2020 Waybill will contain more rates, volumes, origins, and destinations for merchandise traffic rail movements. This means merchandise traffic will contain:

  • Increased number of origin and destination market areas.
  • More accurate estimates of specific commodity volumes going into markets.
  • More accurate estimates of where volumes into markets originate.
  • Improved information on rates shippers compete against in markets.

This increase in merchandise traffic data will be offset by decreasing the number of intermodal movements the Waybill contains. This change is being implemented because the Waybill is primarily used by merchandise traffic shippers. These improvements will go into effect with the release of 2020 Waybill data. The 2020 Waybill data is expected to be released in late 2021, or early 2022.

Waybill Improvement 2

If this improvement is implemented, the Waybill will be released Quarterly, not Annually. This improvement is still being studied by the STB. However, if this change is enacted, Waybill data will become much more current.

In the existing system, Waybill data is at least one year old. Much of the data is closer to two years old before the STB releases an updated Waybill. For example, if the Waybill data for year 2020 is released in December 2021, there will be a one-year lag in data for the fourth quarter of 2020. However, there will be close to a two-year lag for data from the first quarter of 2020.  The new quarterly Waybill system would only have a two-to-four-month delay in rate and volume information for all Waybill data.

Waybill Improvement 2 is important because the more current Waybill data is, the more useful Waybill data becomes!

Importance of Waybill Data

The importance of the Waybill data in determining reasonable rates for rail movements is shown in the following scatter graph:

Updates to STB’s Carload Waybill Statistics

The scatter graph is automatically generated through the Rail Rate Checker Section of the Rail Cost Control Program

The graph shows the following data:

  • Shipper’s rate of $4,000 for a 450-mile Plastic (STCC 28211) movements from Houston, TX to Jackson, MS (yellow diamond)
  • Waybill rates for Plastic moves to Jackson, MS from both Houston, TX (red circles) and Beaumont, TX (green triangle)
  • A $2,430 Average Waybill rate into Jackson, MS (refer to the red line)
  • $3,462 is the rate that is One Standard Deviation above the average Waybill rate (refer to the top blue line)

The graph shows the value shippers get from access to Waybill data. The illustration provides a clear picture of the problems with the $4,000 rate for the shipper’s Plastic movements. The graph shows:

  • The $4,000 rate is more than One Standard Deviation above the Average rate into Jackson, MS
  • Houston rates are $1,000 to $2,5000 higher than rates out of Beaumont, TX
  • The $4,000 rate puts the shipper at a competitive disadvantage in the Jackson, MS market
  • It is difficult for the shipper to compete in this market with a $4,000 rail rate

The Waybill is already a very valuable tool for rail shippers. The STB’s proposed improvements to timeliness and number of moves, will increase the value of the Waybill for rail shippers.


Escalation Consultants, Inc. developed Rail Cost Control (“RCC”)  to help shippers reduce rail expenses by managing costs and empowering negotiations. Furthermore, for more information about RCC and other related articles, visit the RCC Blog.

Rail Cost Control

https://www.railcostcontrol.com/wp-content/uploads/7.png 1080 1080 Keith Nestman https://www.railcostcontrol.com/wp-content/uploads/new-logo-2.svg Keith Nestman2021-04-28 08:00:462021-05-26 15:54:49Updates to STB’s Carload Waybill Sample

Pages

  • About Us
  • AXIS
  • Contact Us
  • Cost Optimizer
  • Database Management System
  • Evaluation Exercise Calendly
  • Evaluation Exercise Contact Form
  • Home
  • Landing Page – 2025
  • Movement Evaluation Exercise
  • News & Events
  • PopUp Testing 05172021
  • Privacy Policy
  • Rail Rate Checker
  • Seminars and Training
  • Video Landing Page – 2025
  • YT

Categories

  • Uncategorized

Archive

  • October 2025
  • September 2025
  • July 2025
  • June 2025
  • November 2024
  • October 2024
  • June 2024
  • February 2024
  • September 2023
  • August 2023
  • July 2023
  • June 2023
  • February 2023
  • January 2023
  • June 2022
  • February 2022
  • January 2022
  • December 2021
  • October 2021
  • August 2021
  • July 2021
  • June 2021
  • May 2021
  • April 2021
  • March 2021
  • February 2021
  • January 2021
  • December 2020

Escalation Consultants has been serving railroad customers since 1979.

The Rail Cost Control Program is an Escalation Consultants Inc. product. For the last 40 years Escalation Consultants has assisted companies in reducing the delivered cost of their products. We are normally involved with large and small rail shippers in reducing rail expenses on more than a billion dollars in rail spend annually.

Escalation Consultants has spent decades developing tools that automatically seek out and quantify opportunities for reducing rail expenses. The RCC contains these tools and they allow you to look at your movements differently in order to create more cost-effective negotiations with railroads.

To learn about Escalation Consultants Inc, more visit www.EscalationConsultants.com

Quick Links

  • AXIS
  • Rail Rate Checker
  • Cost Optimizer
  • Database Management System
  • News & Events
  • Seminars & Training
  • About Us
  • Contact Us
  • Login

Contact Info

4 Professional Drive, Suite 129
Gaithersburg, MD 20879

info@railcostcontrol.com
301-977-7459 

linkedinfacebook

© 2025 Rail Cost Control. All Rights Reserved.

Scroll to top