Benchmark to Reduce Rail Expenses
To reduce rail expenses and consistently improve performance, companies need to consistently benchmark. The reason for benchmarking is simple. If you do not benchmark, you will likely do things the same way next year as you did this year. This means the problems you have this year will not get corrected.
When negotiating with railroads that have monopoly power over your traffic it needs to be recognized that:
You will always tend to receive rate increases
IF
You do not know what reasonable rates are for your movements.
A comparison of railroad’s historical rate changes indicate that railroads are very active with rate benchmarking. The graph below provides an example of the results from railroad benchmarking. It shows the percent change in average rate per car for all Food Product (STCC 20) BNSF movements, versus UP.
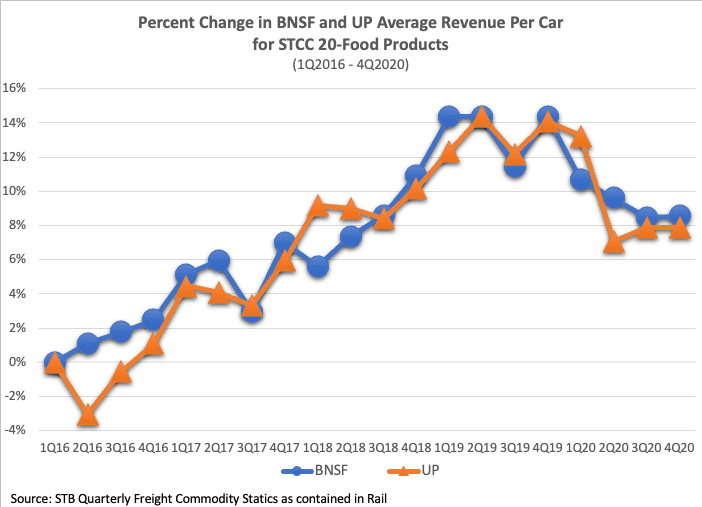
The illustration shows that over the last five years the percent change in the average rate per car for all Food Product moves on BNSF are very similar to those of UP. The percent change in the average rate per car for BNSF and UP frequently separate, but they always tend to come back to the same type of rate change. The overall average rate change is similar for both railroads during most periods with the railroads exchanging places as to who has the highest rate increases from time to time.
Rail shippers should learn from the practices of railroads and use the data available to them to benchmark their rates against the rates of their competitors.
This is valuable information that will show whether a shipper is being put at a competitive disadvantage in its markets. This market intelligence helps shippers improve their competitive position in markets.
Benchmarking is just common sense. It is always important to find out how well you are doing in the market compared to other companies. To demonstrate, the chart below tracks Grain Mill Products (STCC 204) rates, for movements into the Dallas TX market from major origin locations. Rates are organized on the vertical axis and distance shipped on the horizontal axis.
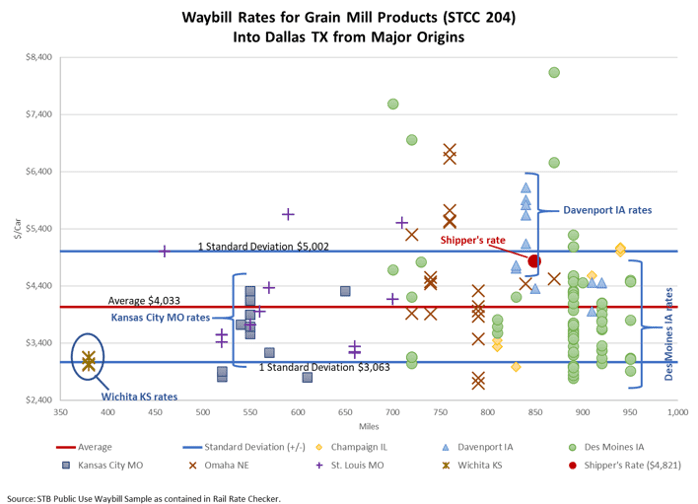
The first thing to notice in this illustration is, that the miles for a movement do not necessarily determine the level of the rate for a movement.
For example, movements from Wichita, KS go the shortest distance to Dallas, TX (370 miles) and movements from Des Moines, IA go the longest distance to Dallas, TX (950 miles). However, many of the rates for both of these origins are similar even though Des Moines, IA moves go almost three times the distance. A similar relationship happens with moves from Kansas City, MO. All the rates from Kansas City, MO are similar to rates from Des Moines, IA even though Kansas City, MO moves go one half the distance to Dallas, TX. This shows that just because you have a geographic advantage in a market does not mean you have a competitive advantage in a market. This is important information for shippers marketing and sales departments to know.
When looking at this graph, assume a supplier to this market is located in Davenport, IA with shipments that travel 850 miles at a rate of $4,821per car, which is the average rate for all shippers from Davenport, IA into Dallas, TX. Some may say this shipper is getting the average rate from Davenport, IA and has nothing to complain about. But, from the shipper’s point of view:
-
Many competitors ship into Dallas, TX for considerably lower rates;
-
Most shippers from Des Moines, IA have significantly lower rates, while shipping a longer distance; and,
-
The average rate into the Dallas, TX market for all movements is $4,033 which is $775 less than this shipper’s rate.
If you are a Davenport, IA shipper with a $6,000 rate you would have even more important issues to discuss with your railroad. If you are a Des Moines, IA shipper with a $7,000 rate, then benchmarking will likely create substantial savings.
Once you know how your rate stacks up against competitors in a market, you have a different negotiation with railroads. You also have different preparation for negotiations, especially if this is one of your more important markets. There are a number of questions the benchmarking exercise raises:
-
Are there other opportunities to reduce the transportation cost through a forward storage site, or transload?
-
Can a commodity swap with another supplier be negotiated in exchange for supplying one of their customers at another destination?
-
Can your competitive carloads be bundled with captive carloads to obtain better rates on captive traffic?
-
What is the impact on the railroad if you don’t serve this market?
Benchmarking rates into a market leads shippers to explore other alternatives for reducing and evaluating rates. The carrier will always say your rate is a market rate; but the carrier’s interpretation of a market rate will include the highest rate any other shipper pays, not necessarily the average rate and certainly not the lowest rate. As long as there is one other shipper with a higher rate, then your carrier’s interpretation will likely be that you have good rates.
Benchmarking helps you educate railroads on:
-
The rates you need;
-
Why you need them; and,
-
The reasons a railroad should give these rates to you.
It is important to benchmark rates with railroads that have monopoly or duopoly power over your traffic. It is important because, this is how you determine what rates are reasonable for your traffic. Without the knowledge obtained from benchmarking you will always tend to get rate increases. Companies benchmark to cut costs and improve performance. Railroads do this and so should shippers!
Escalation Consultants, Inc. developed the Rail Cost Control (“RCC”) program to help shippers reduce rail expenses by managing costs and empowering negotiations. For more information about RCC and other related articles, visit the RCC Blog.