Posts

Database Manager System

Generate Maximum Savings Through Optimizing
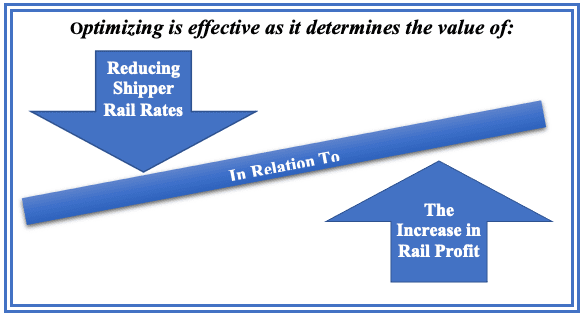
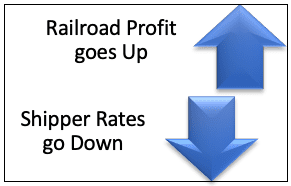
The blog titled Optimizing to Reduce Shippers Rail Expenses showed the process shippers can use to reduce rail expenses by millions of dollars while, at the same time, increasing railroad profit by millions of dollars. This value is created by optimizing railroads rates during a shippers bid evaluation. Win/Win opportunities are created by understanding the relationship between: 

The Reduction in Spend a Shipper Receives from Reduced Rates 

in Relation to 

the Increase in Profit the Railroad can Receive from Obtaining Additional Volumes 


The question that needs to be answered is how does a shipper determine the maximum value it can create through the optimizing process? Determining maximum value from optimizing is important as it brings the rate level of captive movements into rail negotiations. To do this a shipper needs to know the Pivot Point for awarding competitive carloads on each railroad.     

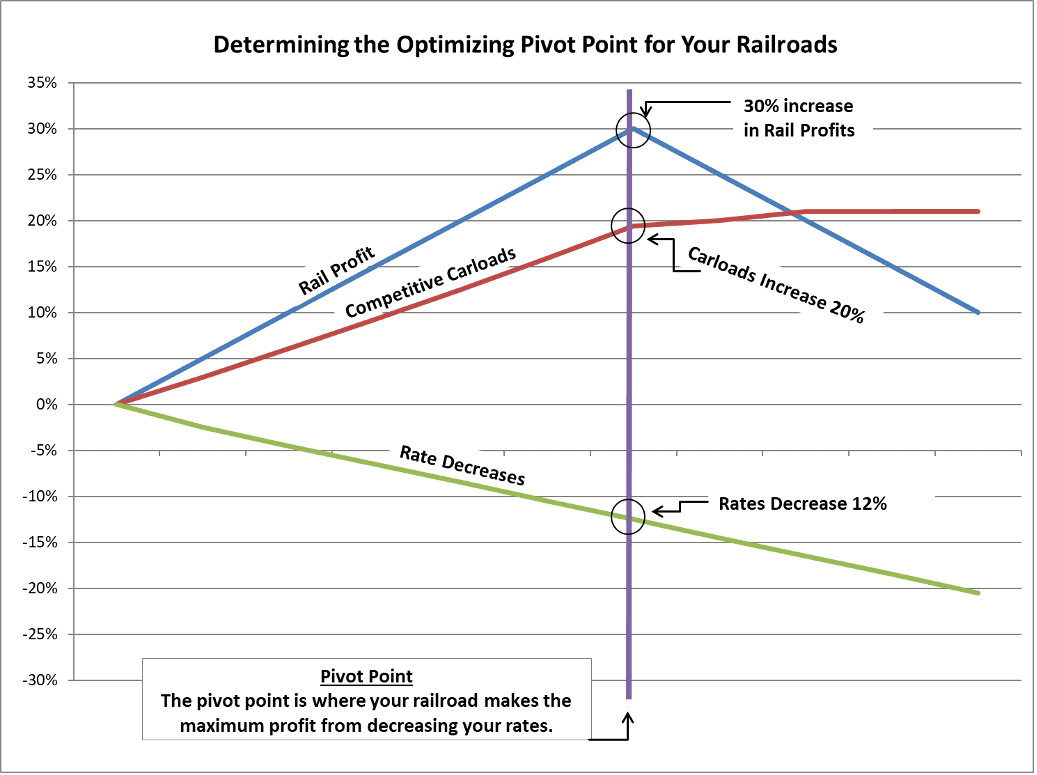
The Pivot Point represents the point where a railroad makes the maximum profit from reducing a shipper’s rates. 

Once the Pivot Point is reached, it becomes less attractive for a railroad to decrease rates to get the award of more competitive carloads. The Pivot Point shows when a rate reduction for the shipper is no longer offset by railroad profit obtained from an increase in carloads.

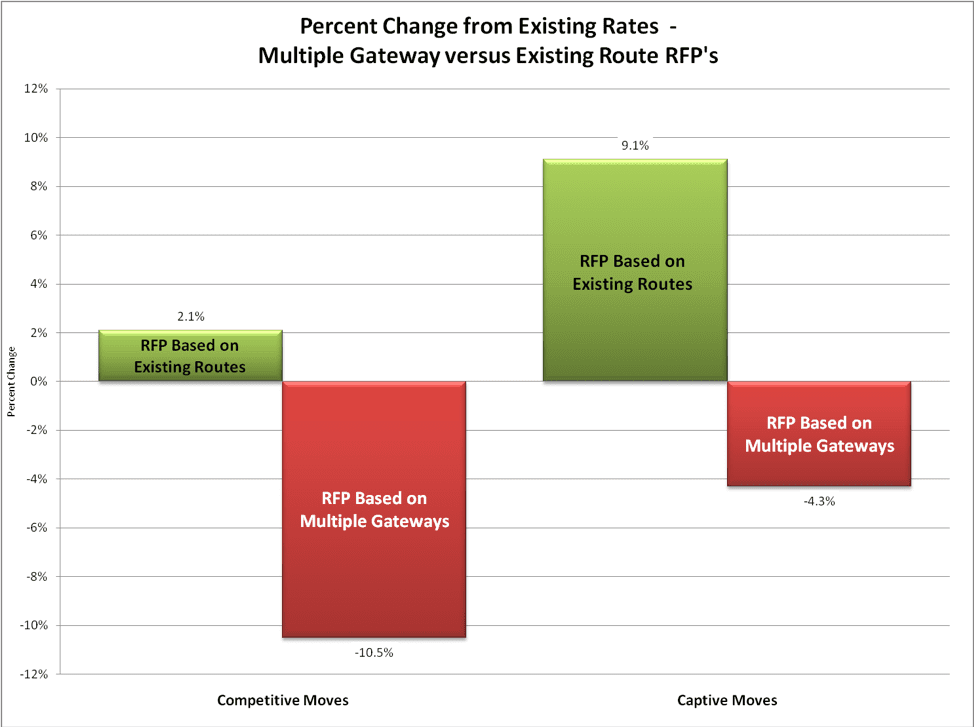
Illustration 1 demonstrates what goes into determining the Pivot Point. Illustration 1 shows that a 12% decrease in bid rates for a railroad’s competitive traffic is the Pivot Point. This decrease results in a 30% increase in the railroad’s profit resulting from a 20% increase in competitive carloads for the railroad. To get the most out of rail negotiations it is important for shippers to know the Pivot Point for rate reductions on each of their railroads. 

Rail Cost Control Pivot Point

Calculating the Pivot Point is an iterative process that continues to reduce rates on competitive movements for a railroad. With each rate reduction carloads are then re-award based on the lowest bids for competitive movements to determine the impact on both the railroad and the shipper. 

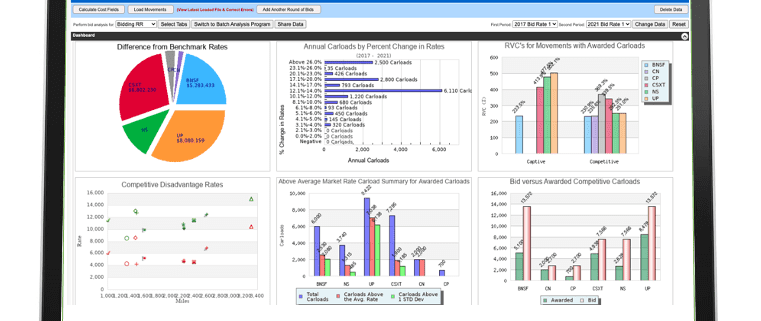
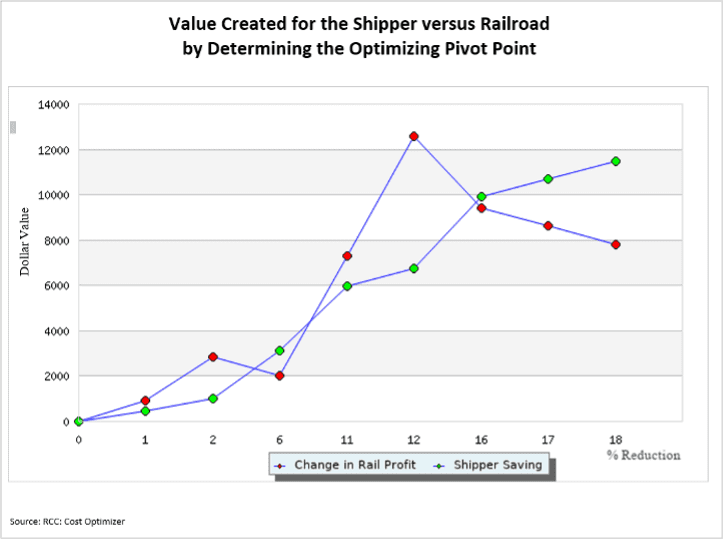
These changes are continually calculated until the Pivot Point is determined. Illustration 2 provides the results of this iterative process for the railroad used in our analysis. This graph shows the dollar savings for the shipper in relation to the change in rail profit for the railroad. These changes result from rate reductions of 1% to 18% in a railroad’s bid rates.

(Note to visually see the impact on rail profit and shipper savings, all dollar values are shown as positive amounts)

A 12% reduction in competitive rates represents the Pivot Point, as this generates the maximum amount of profit the railroad obtains from the award of more carloads. Railroad profit starts decreasing with rate reductions greater than 12%. Shipper’s savings continue to increase with rate reductions but by a 16% reduction the benefit to the shipper is greater than to the railroad. The source for Illustration 2 is the Rail Cost Control Program (RCC).

Rail Cost Control Pivot Point Optimized

Initially, the Pivot Point normally generates greater value for railroads than shippers.

This is because it represents the maximum increase in profit a railroad can get from reducing its rates. The table below demonstrates this as it summarizes the results for the rail bids used in this article.


Table 1

Summary Results for a 12% Rate Reduction on a Railroads Competitive Rates  

Shipper Savings 

$6.7 million 

Increase in Railroad Profit 

$12.5 million 

Increase in Railroad Revenue 

$23.0 million 

Increase in Railroad Carloads 

5,100 

**Table 1 Source: Output Table from the RCC – Cost Optimizer**

Table 1 shows that the railroad makes out much better than the shipper. The railroad makes $12.5 million in additional profit, while the shipper receives savings of $6.7 million. This difference brings rate reductions for captive movements into the optimizing process. Rates for captive movements become part of an iterative process that determines the best split of the benefits between the shipper and railroad through the optimizing process. The source for Table 1 is the Rail Cost Control Program.

Table 2 provides the results from optimizing after rate reductions for captive rates are included in the optimization process. This table shows the shippers expense is reduced by $9.6 million while the railroads profit is increased by $9.6 million. This is a good deal for the railroad as it makes $9.6 million more in profit and $20 million more in rail revenue than it would receive based on its initial bid rates. This is also a good deal for the shipper as its rail expenses are reduced by $9.6 million.

Table 2

Change from Bid Rates Summary Results After Captive Rates are Included in the Optimizing Process

Shipper Competitive Spend Saving

-$6,814,188

Shipper Captive Spend Savings

-$2,826,917

Shipper Total Savings

-$9,641,105

Railroad Competitive Profit

$12,556,031

Railroad Captive Profit

-$2,904,317

Increase in Total Railroad Profit

$9,651,714

Increase in Railroad Spend

$20,135,460

Increase in Railroad Carloads

$5,100

**Table 2 Source – Output Table from the RCC – Cost Optimizer**

When shippers are armed with opportunities created by optimizing rail expenses, they create value for themselves and their railroads. Shippers reduce the rate structure for their movements, while substantially improving profit and carloads for railroads.

The best negotiations are win/win negotiations and optimizing creates this type of negotiation. Therefore, the question is, why haven’t more shippers used optimization to reduce their rail expenses?  The answer is complexity and time constraints. This was the reason for the development of the Rail Cost Control (RCC) Program. The algorithms in the RCC’s Cost Optimizer automatically determine the Pivot Point for each railroad and the results to expect from the optimizing process, for both the shipper and railroad. This is a game changer for many companies.


For more information on optimizing rail expenses, check out the Rail Cost Optimizer. 

Escalation Consultants, Inc. developed Rail Cost Control (“RCC”)  to help shippers reduce rail expenses by managing costs and empowering negotiations. Furthermore, for more information about RCC and other related articles, visit the RCC Blog.

Rail Rate Checker Banner

Rail Cost Control Cost Optimizer

Optimizing to Reduce Shippers Rail Expenses

The most productive rail negotiations are win/win negotiations where a shipper gets lower rates and the railroad makes greater profit. These type of win/win negotiations are easier to develop than many shippers realize. The best way to create this type of win/win outcome is by a shipper optimizing railroads rates when performing the bid evaluation.

Optimize Your Rail Spend

Millions of dollars in value are created for shippers and railroads through the optimizing process: 

        • The benefit to shippers is cost reductions of 5% to 15%; while, 
        • Railroads benefit from a substantial increase in revenue and profits.

This optimizing process starts by a shipper calculating the railroad’s long term Variable Cost (Cost). This Cost is calculated for ALL rates in a railroad’s bid. Shippers frequently calculate the railroad’s cost for a movement to show that a railroad is making too much profit from the movement. Unfortunately, this is frequently not very effective.

A more productive use of railroad costs is to better understand how a shipper can increase or decrease railroad’s profits with volumes it can add or takeaway in negotiations.

Calculating railroads cost for all of a shipper’s moves, opens opportunities to create greater value for both shippers and railroads. It is best for a shipper to use a macro processing program like the Rail Cost Control Program  (RCC) to calculate the cost of all rail moves at one time. Calculations are effortless, as rail costs are automatically calculated and maintained for use in RCC’s bid evaluation optimizing program 

Once a shipper knows the railroads costs for moves, it has a much better understanding of the economic impact of adding, or taking away, moves from railroads in the bid evaluationWhen a railroads rates are reduced it becomes the low bidder on more competitive traffic in the bid evaluation. As a railroad wins more competitive traffic, its carloads increase as well as the profit it makes from the shipper’s business.  

It is important to find win/win opportunities with your railroads. These opportunities come from understanding the relationship between reductions in spend a shipper receives from reduced rates versus the increase in profit the railroad receives from obtaining additional volumes

As an example, if competitive rates are reduced by 11% on a railroad resulting in $6 million in savings this looks like a great deal for the shipper. But is this a good deal for the railroad? The shipper needs to know the economic impact on the railroad. If the railroad is awarded an additional 3,100 carloads, because it is now the low bidder on more competitive carloads, the shipper needs to know how this impacts railroad profit. Table 1 provides a summary of the results for the 11% rate decrease.  

Table 1 

 Example of Summary Results for a 11% Rate Reduction on a Railroads Competitive Moves   

Shipper Savings
$6.0 million
Increase in Railroad Profit
$7.3 million
Increase in Railroad Revenue
$13.4 million
Increase in Railroad Carloads
3,100

Railroad Profit vs Shippers Rates

Table 1 shows that the 3,100 additional carloads represent a $7.3 million increase in the railroad’s profit. This is $7.3 million in profit and $13.4 million in revenue the railroad would not get with the rates in its original bid. Table 1 shows that the railroad makes out better than the shipper from the 11% rate decrease. The value to the railroad is $1.3 million greater ($7.3 million versus $6.0 million) than the value to the shipper. By optimizing, you then equalize the benefits from strategic decisions on rates and volumes.

Optimizing created $6 to $7 million in value for both the shipper and the railroad. 

Though the value created by the 11% rate decrease is significant, it may not be the best rate decrease for either the shipper or the railroad. The question that needs to be answered, is how do you know the rate decrease that creates the most value for the shipper and railroad? Would a larger 15% rate decrease generate greater value or would a lower 7% rate decrease work best. Answering this question, you’ll need to know the optimizing Pivot Point for rates in each railroad’s bids for competitive traffic.

Understanding each railroads Pivot Point is important as it: 

  1. Generates greater value from the optimizing process; and, 
  2. Brings captive rail movements rates into the optimizing process. 

Understanding the Pivot Point increases the value created from optimizing. As an examplethe Pivot Point for the rail traffic used in this article increases the value created by optimizing by an additional 71% (more than a $5 million increase) . This is not an unusual Pivot Point optimizing result for mid to large rail shippers. Optimizing the rates in railroads bids creates a significant increase in value for the shipper and the railroad. 

It should be noted that though the calculations for optimizing are complex the process has become very easy to perform. For example, the Pivot Point is automatically calculated for the rates in each railroad’s bids in RCC’s: Cost Optimizer 

Our next blog will address determining the Pivot Point for each railroad and bringing captive rates into the optimizing process. 


 Escalation Consultants, Inc. developed Rail Cost Control (“RCC”)  to help shippers reduce rail expenses by managing costs and empowering negotiations. Furthermore, for more information about RCC and other related articles, visit the RCC Blog.


Rail Cost Optimizer

close up view of railroad tracks at dusk

Decrease Your Rail Rates by Increasing Your Pricing Options

Rail shippers all agree that it is better to have multiple rate options for a movement instead of just one.

The easiest way to increase your rate options is to have railroads provide Rule 11 rates through multiple gateways. 

The following bar chart provides an example of the potential reduction in rail expenses a shipper can obtain from using a Multiple Rail Gateway Request for Proposal (RFP) on Rule 11 moves.  Each bar represents the percent change from existing rates using a Multiple Gateway RFP and a RFP based on existing rail routes for captive and competitive moves.


The bars reflect an analysis of actual results from bid evaluations. The chart shows a reduction occurs in both captive and competitive rail expenses when Multiple Gateway RFP’s are used, but rate decreases are much larger on competitive movements.

Results normally vary based upon a shipper’s volume of captive and competitive traffic. However, having three rate options instead of one creates downward pressure on rates for both captive and competitive moves that simply doesn’t exist without this functionality.

The problem with Multiple Gateway RFP’s is: they have been very difficult to create and evaluate.

Fortunately, that has changed! Multiple Gateway RFP’s are being used by more shippers as improved technology now makes it easier to create and evaluate them.

In the past, to create a Multiple Gateway RFP you needed to know the following for each movement:

  • The railroads serving your origin
  • The railroads serving your destination
  • The major gateways where the origin and destination railroads interchange traffic to the destination area

The flow chart below is for the creation of a Multiple Gateway RFP for an NS move. This move is originating in Knoxville, TN and terminating on either the UP or BNSF railroads in Los Angeles, CA.


Multiple Gateway Railroad RFP


The flow chart shows that the shipper’s RFP’s for NS, UP and BNSF must include a request for nine (9) rates from the three railroads for this one movement:

  • NS RFP needs four (4) rates from Knoxville, TN to major gateways with UP and BNSF
  • BNSF RFP needs three (3) rates from the gateways on BNSF to the Los Angeles destination
  • UP RFP needs two (2) rates from the gateways on UP to the Los Angeles destination

If a shipper has hundreds of moves, in the past, the RFP could take months to assemble for all railroads.

The bid evaluation was also more complex. This slowed down the bid evaluation process at a time when contracts were ending and time was critical.

Significant cost reductions normally result from a Multiple Gateway RFP, but this process was always significantly more time consuming. This has changed!

The Rail Cost Control (RCC) program represents a significant improvement in technology that makes it easy to create and evaluate Multiple Gateway RFP’s. To do this, shipper’s moves are loaded into the program’s Database Management System. Then, the program’s Cost Optimizer automatically generates Multiple Gateway RFP’s for all movements on each railroad through commonly used gateways. The RCC creates the RFP so it automatically reads railroad responses to the RFP.

The Rail Cost Optimizer then automatically:

  • Evaluates all railroad’s responses and determines your least cost routing option and awards traffic to that option;
  • Creates win/win optimizing opportunities that decrease your cost, while increasing railroads profits; and,
  • Creates cost effective counter proposals for your railroads.

The Rail Cost Control program is an Escalation Consultants product that represents a significant improvement in technology. The RCC has a material impact on a shipper’s rail expenses.


Rail Cost Control (“RCC”) is a program developed by Escalation Consultants to help shippers reduce rail expenses by managing costs and empowering negotiations. For more information about RCC and other related articles, visit the RCC Blog.

Rail Rate Checker Banner