• Solutions
    • AXIS
    • Rail Rate Checker
    • Cost Optimizer
    • DMS
  • Company
    • About Us
    • Contact Us
  • News & Events
  • Seminars and Training
  • Login
  • Start Your Free Trial
  • Schedule Call
  • Menu Menu

Archive for category: Uncategorized

Rail Cost Control Webinar Recording

CN & KCS Merger Webinar Recording

July 28, 2021

Developing Your Company’s Position on the KCS – CN Rail Merger

Rail shippers will soon need to determine the best position for their company to take on the KCS rail merger with CN. All rail shippers will take one of four primary positions, regarding the merger:

  • Fight the approval of the merger;
  • Stay uninvolved;
  • Support the merger; or,
  • Obtain economic concessions through flexibility with your merger position.

The positive and negative impact of these positions are covered in this webinar.

The focus of this webinar is to determine a realistic path forward for making educated decisions for your company on the merger.

Escalation Consultants, Inc. developed the Rail Cost Control (“RCC”) program to help shippers reduce rail expenses by managing costs and empowering negotiations. For more information about RCC and other related articles, visit the RCC Blog.

https://www.railcostcontrol.com/wp-content/uploads/KCS-Merger-Webinar-Recording.png 1080 1080 Keith Nestman https://www.railcostcontrol.com/wp-content/uploads/RCC-Logo-2026.svg Keith Nestman2021-07-28 07:00:382021-07-28 15:09:53CN & KCS Merger Webinar Recording
Rail Contracts: Preparing for Rapid Inflation

Rail Contracts: Preparing for Rapid Inflation

July 20, 2021

Prepare for the Impact of Rapid Inflation on Rail Rates and Escalation in Rail Contracts

Rail contract escalation provisions will be impacted by big changes taking place in the overall economy, as well as changes occurring in the rail industry. The railroad index frequently used to escalate rail contracts is titled: All Inclusive Index Less Fuel. This index is frequently referred to as “A-List.”

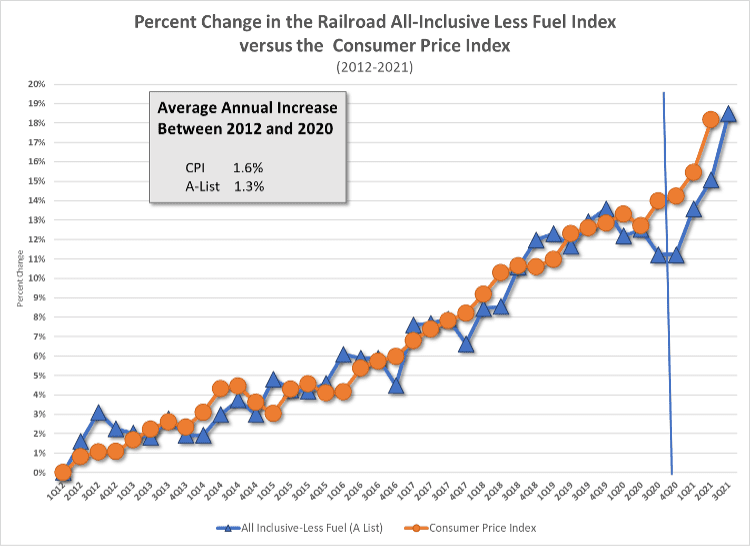
Illustration 1 tracks the percent change in the A-List index against the change in the CPI since Q1 2012.


Illustration 1

Percent Change of A-List vs CPI Indexes 1

The illustration above shows very moderate increases for both the A-List and CPI indexes through the end of 2020.

The average annual increase in overall inflation, as measured by the CPI, was only 1.6% between 2012 and 2020. Inflation in the railroad industry was even lower as the average annual increase in the railroads A-List index was only 1.3%.

In 2021 the world changed dramatically for inflation in the economy as well as the railroad industry. The inflationary increases in 2021 are the largest the U.S. has experienced since the early 1980’s. This will have a big impact on railroads and rail shippers in the coming months.

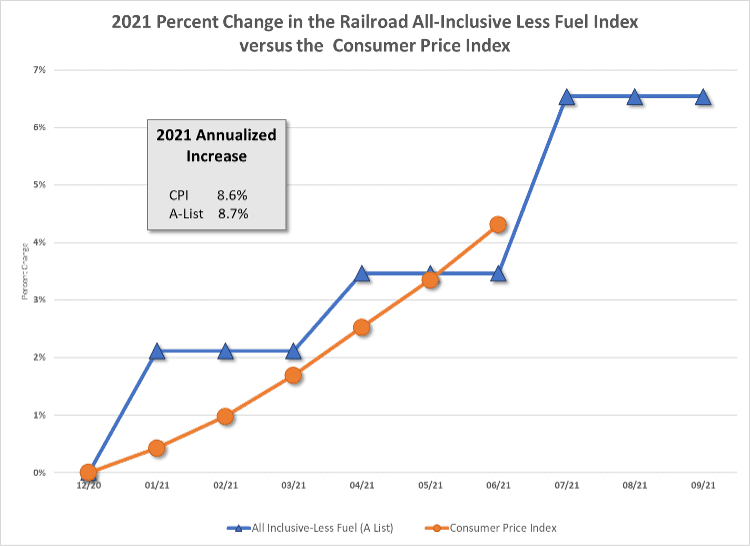
To zero in on the changes taking place in 2021, Illustration 2 tracks the changes in these indexes from Q4 2020, to the most current time period available for each index. The A-List index is published quarterly and is always projected out one quarter. This means it is available through Q3 2021, while the CPI is available through June 2021.

Illustration 2

Percent Change of A-List vs CPI Indexes 2

Illustration 2 shows that the A-List increased 6.5%. Roughly half of this increase occurred between Q2 and Q3 of 2021. The CPI increased 4.5% and is expected to have large increases for at least the rest of this year.

If the 2021 changes in the CPI and A-List indexes are annualized, 

they would have a rate increase of close to 9%. 

This type of inflation has not been seen since the 1980’s and this will likely have a big impact on rail rates and the escalation provisions of multi-year contracts. How rail shippers address this will have a big impact on their cost of rail freight.

Escalation Consultants is in a unique position to assist shippers on this issue as we have been active in:
  • Developing escalation provisions for company’s contracts for over forty (40) years and
  • Resolving pricing issues with contract escalation problems that created big winners and losers.

With rapid inflation contract escalation provisions can easily create big winners and losers. For example, in the 1980’s and 1990’s Escalation Consultants helped resolve contract escalation problems where hundreds of millions of dollars were at issue in long term contracts.

We learned that:
  • With rapid inflation, a contract must have an effective process for insuring that the escalation provisions don’t generate big winners and losers; and
  • It is much less expensive to develop escalation provisions properly at the inception of a contract, than to try and resolve disputes after the magnitude of an escalation problem is already known.
Before agreeing to escalation provisions for your contracts, Contact Escalation Consultants to explore the option that best suits your company’s unique shipping needs. This will likely save you significant time, frustration, and money.


Escalation Consultants, Inc. developed the Rail Cost Control (“RCC”) program to help shippers reduce rail expenses by managing costs and empowering negotiations. For more information about RCC and other related articles, visit the RCC Blog.


https://www.railcostcontrol.com/wp-content/uploads/Webinar-8.png 1080 1080 Keith Nestman https://www.railcostcontrol.com/wp-content/uploads/RCC-Logo-2026.svg Keith Nestman2021-07-20 15:23:542021-07-22 14:23:14Rail Contracts: Preparing for Rapid Inflation
Rail Carloads Rebound from Covid-19

Rail Carloads Rebound from COVID-19

June 9, 2021
COVID-19 has had a big impact on everything including rail traffic. The good news is that: 
  • Intermodal traffic has rebounded far above pre-COVID-19 levels; and, 
  • Bulk rail traffic has finally risen to pre-COVID levels.  

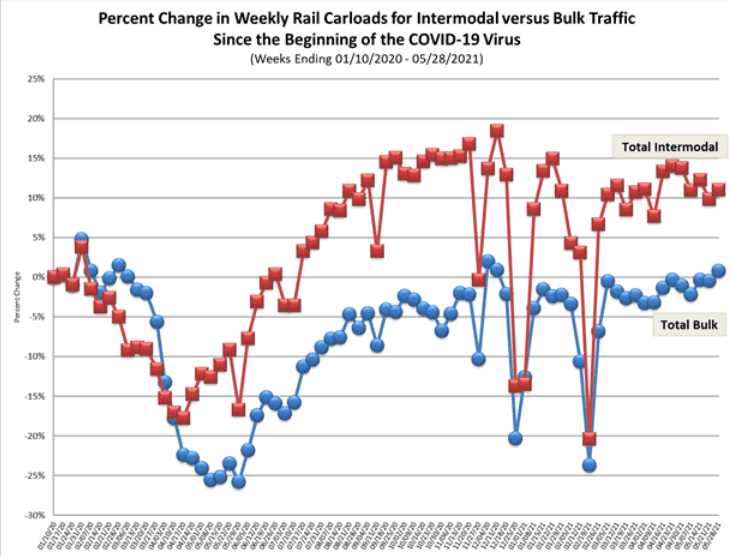
The graph below shows that weekly Intermodal traffic is up 11% from January 2020. It also shows that Bulk rail traffic has finally risen 1% above pre-COVID-19 levels. 

RCC Blog: Percent Change in Weekly Rail Carloads for Intermodal vs Bulk Traffic

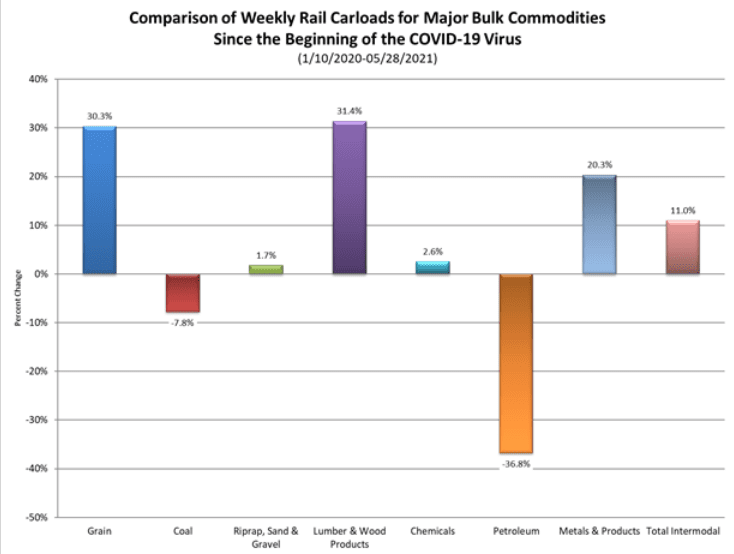
The graph below shows that, except for Coal and Petroleum, Bulk rail traffic has increased for major commodities. Both Coal and Petroleum have factors other than the economy influencing their decrease in carloads. The largest increase in Bulk carloads has been in Lumber & Wood Product 31.4%, Grain 30.3%, and Metal Products 20.3%. Chemicals and Sand & Gravel have only rebounded slightly from pre-COVID levels. 

The increase in rail carloads paints a positive picture of the US economy. The rise in carloads for both Bulk and Intermodal Traffic indicate that the economy has largely recovered from the negative impact of COVID-19. 

RCC Blog: Comparison of Weekly Rail Carloads for Major Bulk Commodities

Weekly Rail Carloads comes from the Rail Rate Checker section of the Rail Cost Control program’s extensive database of rail cost, rates, volumes, and rail profit which is used by many shippers to determine reasonable rates for their movements. For more information go to RailCostControl.com. 


Escalation Consultants, Inc. developed the Rail Cost Control (“RCC”) program to help shippers reduce rail expenses by managing costs and empowering negotiations. For more information about RCC and other related articles, visit the RCC Blog.

KCS Merger Webinar Registration

https://www.railcostcontrol.com/wp-content/uploads/Webinar-7.png 1080 1080 Keith Nestman https://www.railcostcontrol.com/wp-content/uploads/RCC-Logo-2026.svg Keith Nestman2021-06-09 19:35:402021-06-10 20:36:17Rail Carloads Rebound from COVID-19
Rail Cost Control Blog - Rail Rates

Rail Rates – When is Enough, Enough?

May 25, 2021

Carriers and shippers agree: railroads need to be profitable to have a healthy and vibrant railroad system. To provide the best service possible, railroads need to be able to make the capital investment needed to move traffic efficiently and that requires a good return on their investment in track, equipment, and facilities. Carriers and shippers, therefore, agree that railroads need to have a rate structure for their traffic that allows them to operate profitably and efficiently. 

The disagreement between carriers and shippers regarding soaring rates comes down to when is enough, enough? 

In other words, when are the rates and rate increases imposed on rail traffic excessive? This is an important issue as excessive rates can have many negative consequences. Excessive rail rates can be damaging to the U.S. economy, the economy of individual states as well as the financial strength of individual companies. The negative impact occurs because excessive rail rates can: 

  • Cause companies to move production off-shore; 
  • Result in an increase in imports into the U.S.; 
  • Cause bulk traffic to move from rail to already congested highways; 
  • Limit capital investment at operations subject to ever increasing high rail rates; and, 
  • Put companies at a competitive disadvantage in domestic and export markets. 

Shippers understand that rail rates which are too low can be damaging to railroads. Railroads do not, however, seem to fully recognize that excessively high rail rates are damaging to both rail shippers, AND the economy. The question that needs to be answered, is: 

What are “reasonable” rates for railroads to charge for moving their traffic? 

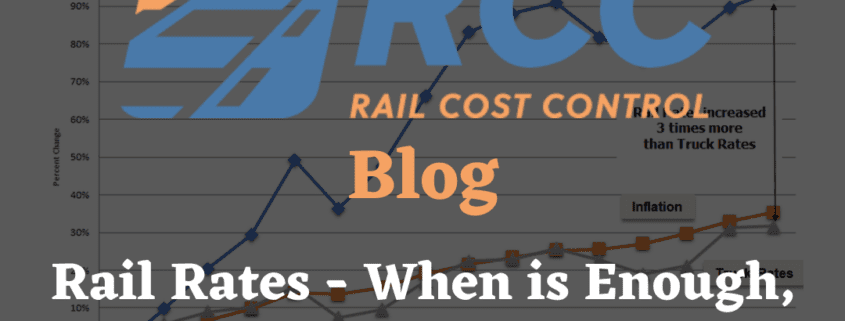
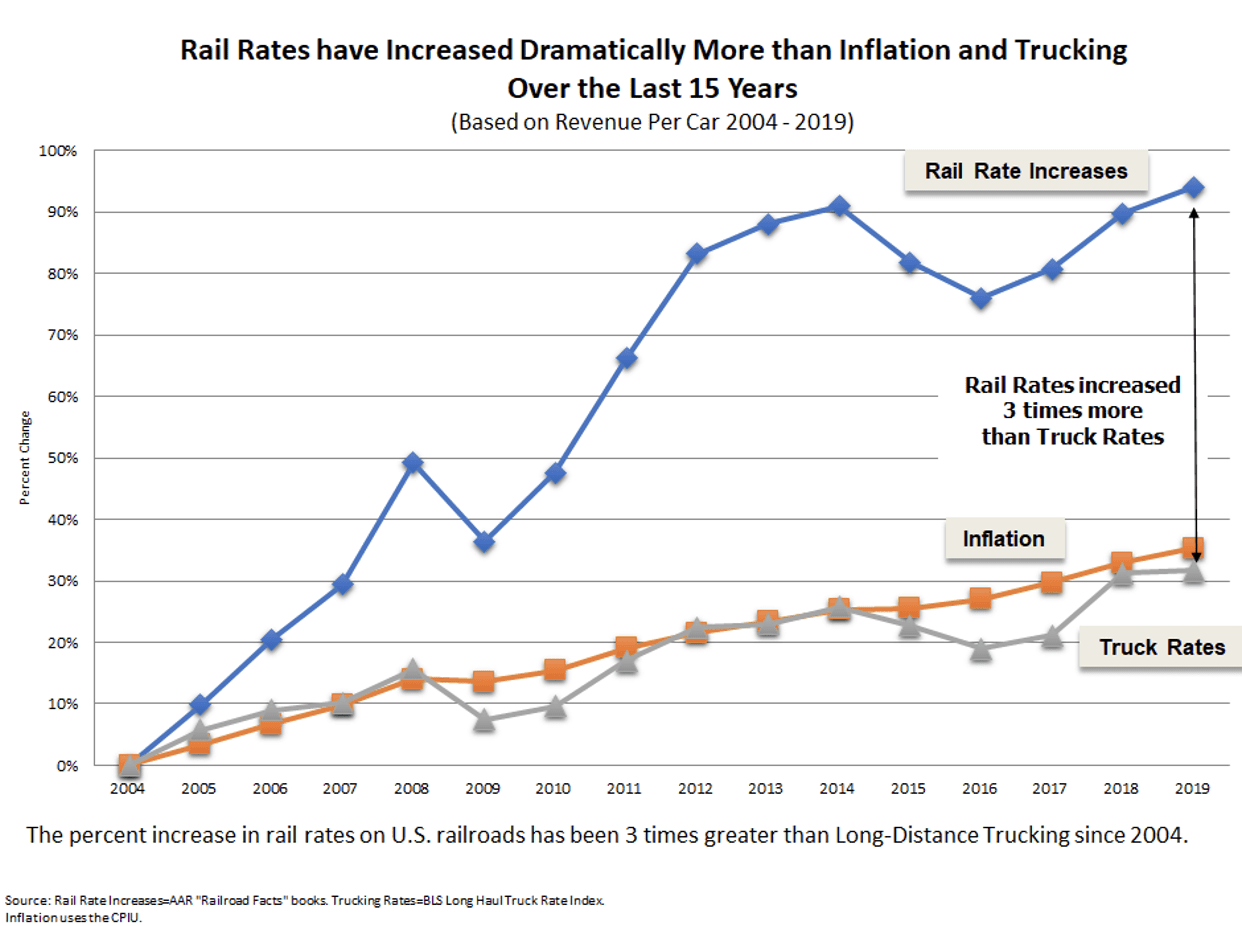
The level of rate increase for rail freight, compared to other benchmarks, is a good indicator of railroad’s concern about the impact of their rates on companies. The illustration below tracks the historical percent change in rail rates against rates for long-distance trucking and inflation. Rail rates are determined using Association of American Railroads (AAR) average revenue per car data.

Rail Rates Increased More than Inflation

The illustration shows that rail rates increased by 94.2 % over the fifteen years between 2004 and 2019 (2019 is the last year reported).

During this same time frame, Long Distance Trucking freight rates increased 31.7%. Rail rates, therefore, increased three times more than the rates for trucking which is the railroad’s primary competitor. Inflation, as measured by the CPI, increased 35.4%. Rail rates, therefore, increased 2.7 times more than overall inflation.

As a result of the change in economics between truck and rail, trucks are now competing against railroads for longer distance movements. The big increase in the cost of rail freight has made trucking less expense than rail for many movements. This has resulted in traffic being taken off rail which contributes to greater congestion on highways. The cost of moving traffic by truck no longer appears to be effective competition as railroads have increased their rates 63% more than truck rates over the last fifteen years.

The remarks in this article should be qualified by saying that we have the highest admiration for the management of railroads. They have been a huge success for their investors as shown by the increase in the value of their stock. Rail management has taken the advantages and disadvantages of the current regulatory system and used it very effectively to create value for its stockholders. That is what effective management of any company should do and the railroads have done it better than most. On the other hand, shippers are concerned that railroads have become too adept at using the existing regulatory environment to their advantage.

Shippers are concerned about the power of railroads to keep churning out rate increases even as shippers fight for survival during these troubled times.

In looking at the current railroad industry I am reminded of a negotiation I was involved in many years ago. In this negotiation I asked the question, “When is enough, enough?” The response was very honest, “It is never enough!” The troubling fact is that this appears to be the mantra when it comes to rail rates today.


Escalation Consultants, Inc. developed the Rail Cost Control (“RCC”) program to help shippers reduce rail expenses by managing costs and empowering negotiations. For more information about RCC and other related articles, visit the RCC Blog.


KCS Merger Webinar Registration

https://www.railcostcontrol.com/wp-content/uploads/5.png 1080 1080 Keith Nestman https://www.railcostcontrol.com/wp-content/uploads/RCC-Logo-2026.svg Keith Nestman2021-05-25 20:29:122021-06-16 14:23:36Rail Rates – When is Enough, Enough?
Rail Cost Control Webinar #2

RCC Webinar #2 – Using Competitor’s Rates to Reduce Your Rail Rates

May 18, 2021

Rail Cost Control Webinar #2

What:

Creating Rail Rate Reduction Opportunities by Using Competitor’s Rates to Reduce Your Rail Rates

Where:

GoToWebinar – Click Here to Register

When:

Tuesday, May 25, 2021 @ 10:00 AM – 10:30 AM EST

How:

To register for the upcoming FREE Webinar, click here.

Why:

Railroads love to say they are pricing you into the market but how do you know what market price actually is? This 30-min FREE webinar will discuss how you can understand how your rates stack up in the marketplace and if you are being put at a competitive disadvantage to your competitors. This is integral information to be aware of but more importantly, to show your railroads that you know what market price is. Railroads thrive on a lack of rate transparency and it is up to you to provide that transparency!

There will be a Q&A session at the end of the webinar where questions you have about the data and how to use it will be answered. This is meant to be an informative webinar to help you reduce your rail expenses.

This webinar is being put on by Escalation Consultants, Inc. who has been serving railroad customers since 1979.

For the last 40 years, Escalation Consultants has assisted companies in reducing the delivered cost of their products. We are normally involved with large and small rail shippers in reducing rail expenses on more than a billion dollars in rail spend annually.


Escalation Consultants, Inc. developed the Rail Cost Control (“RCC”) program to help shippers reduce rail expenses by managing costs and empowering negotiations. For more information about RCC and other related articles, visit the RCC Blog.

Rail Cost Control Webinar

https://www.railcostcontrol.com/wp-content/uploads/Webinar-4.png 1080 1080 Keith Nestman https://www.railcostcontrol.com/wp-content/uploads/RCC-Logo-2026.svg Keith Nestman2021-05-18 21:03:532024-12-05 16:00:20RCC Webinar #2 – Using Competitor’s Rates to Reduce Your Rail Rates
Benchmark to Reduce Rail Expenses

Benchmark to Reduce Rail Expenses

May 12, 2021

To reduce rail expenses and consistently improve performance, companies need to consistently benchmark. The reason for benchmarking is simple. If you do not benchmark, you will likely do things the same way next year as you did this year. This means the problems you have this year will not get corrected.

When negotiating with railroads that have monopoly power over your traffic it needs to be recognized that:

You will always tend to receive rate increases

IF

You do not know what reasonable rates are for your movements.

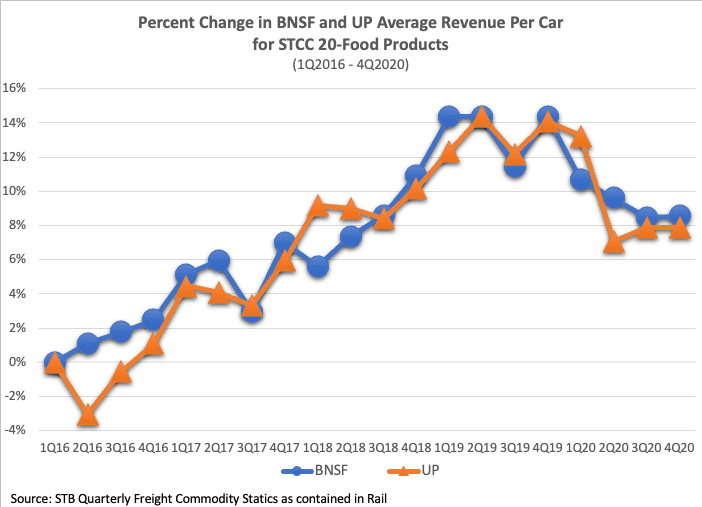
A comparison of railroad’s historical rate changes indicate that railroads are very active with rate benchmarking. The graph below provides an example of the results from railroad benchmarking. It shows the percent change in average rate per car for all Food Product (STCC 20) BNSF movements, versus UP.
Rail Rate Benchmarking Blog Illustration 1

The illustration shows that over the last five years the percent change in the average rate per car for all Food Product moves on BNSF are very similar to those of UP. The percent change in the average rate per car for BNSF and UP frequently separate, but they always tend to come back to the same type of rate change. The overall average rate change is similar for both railroads during most periods with the railroads exchanging places as to who has the highest rate increases from time to time.

Rail shippers should learn from the practices of railroads and use the data available to them to benchmark their rates against the rates of their competitors.

This is valuable information that will show whether a shipper is being put at a competitive disadvantage in its markets. This market intelligence helps shippers improve their competitive position in markets.

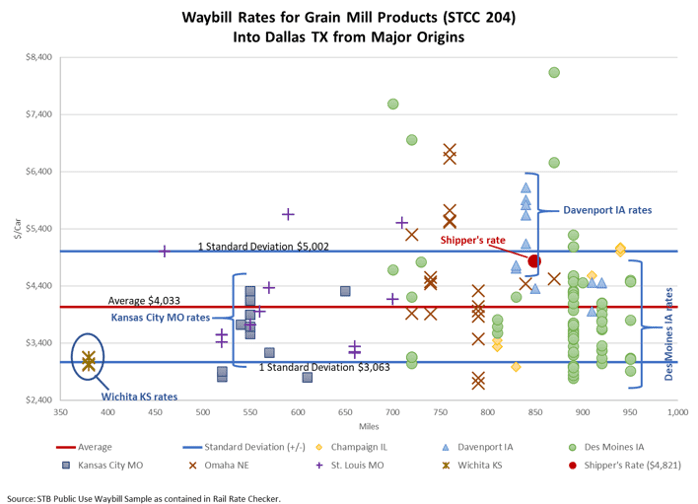
Benchmarking is just common sense. It is always important to find out how well you are doing in the market compared to other companies. To demonstrate, the chart below tracks Grain Mill Products (STCC 204) rates, for movements into the Dallas TX market from major origin locations. Rates are organized on the vertical axis and distance shipped on the horizontal axis.
Rail Rate Benchmarking Blog Illustration 2

The first thing to notice in this illustration is, that the miles for a movement do not necessarily determine the level of the rate for a movement.

For example, movements from Wichita, KS go the shortest distance to Dallas, TX (370 miles) and movements from Des Moines, IA go the longest distance to Dallas, TX (950 miles). However, many of the rates for both of these origins are similar even though Des Moines, IA moves go almost three times the distance. A similar relationship happens with moves from Kansas City, MO. All the rates from Kansas City, MO are similar to rates from Des Moines, IA even though Kansas City, MO moves go one half the distance to Dallas, TX. This shows that just because you have a geographic advantage in a market does not mean you have a competitive advantage in a market. This is important information for shippers marketing and sales departments to know.

When looking at this graph, assume a supplier to this market is located in Davenport, IA with shipments that travel 850 miles at a rate of $4,821per car, which is the average rate for all shippers from Davenport, IA into Dallas, TX. Some may say this shipper is getting the average rate from Davenport, IA and has nothing to complain about. But, from the shipper’s point of view:

  • Many competitors ship into Dallas, TX for considerably lower rates;

  • Most shippers from Des Moines, IA have significantly lower rates, while shipping a longer distance; and,

  • The average rate into the Dallas, TX market for all movements is $4,033 which is $775 less than this shipper’s rate.

If you are a Davenport, IA shipper with a $6,000 rate you would have even more important issues to discuss with your railroad. If you are a Des Moines, IA shipper with a $7,000 rate, then benchmarking will likely create substantial savings.

Once you know how your rate stacks up against competitors in a market, you have a different negotiation with railroads. You also have different preparation for negotiations, especially if this is one of your more important markets. There are a number of questions the benchmarking exercise raises:

  1. Are there other opportunities to reduce the transportation cost through a forward storage site, or transload?

  2. Can a commodity swap with another supplier be negotiated in exchange for supplying one of their customers at another destination?

  3. Can your competitive carloads be bundled with captive carloads to obtain better rates on captive traffic?

  4. What is the impact on the railroad if you don’t serve this market?

Benchmarking rates into a market leads shippers to explore other alternatives for reducing and evaluating rates. The carrier will always say your rate is a market rate; but the carrier’s interpretation of a market rate will include the highest rate any other shipper pays, not necessarily the average rate and certainly not the lowest rate. As long as there is one other shipper with a higher rate, then your carrier’s interpretation will likely be that you have good rates.

Benchmarking helps you educate railroads on:

  • The rates you need;

  • Why you need them; and,

  • The reasons a railroad should give these rates to you.

It is important to benchmark rates with railroads that have monopoly or duopoly power over your traffic. It is important because, this is how you determine what rates are reasonable for your traffic. Without the knowledge obtained from benchmarking you will always tend to get rate increases. Companies benchmark to cut costs and improve performance. Railroads do this and so should shippers!

Escalation Consultants, Inc. developed the Rail Cost Control (“RCC”) program to help shippers reduce rail expenses by managing costs and empowering negotiations. For more information about RCC and other related articles, visit the RCC Blog.
Database Management System

https://www.railcostcontrol.com/wp-content/uploads/4.png 1080 1080 Keith Nestman https://www.railcostcontrol.com/wp-content/uploads/RCC-Logo-2026.svg Keith Nestman2021-05-12 08:00:022021-06-01 13:44:26Benchmark to Reduce Rail Expenses
RCC Blog - Why Some Rail Shippers Get Lower Rates

Why Some Rail Shippers Get Lower Rates

May 5, 2021

Rail shippers that are smarter about their movements get better rates for their traffic.  

Escalation Consultants, Inc. is in a unique position to see this, as many shippers use our databases to get better rates for their rail movements. The fact is: shippers who know more about their traffic do better in negotiating rates with their railroads.  

Shippers least cost leverage for obtaining better rates from railroads starts with benchmarking and costing rates for their movements.  

The following are examples of how rail shippers have used Escalation Consultants’ market intelligence database to their advantage:      

 1. A Captive shipper showed the railroad the impact its current rate structure has on reduced volumes into major markets. Market intelligence showed the rates needed to protect this business.  

Result – Shipper’s rates were reduced more than 10% to pertinent markets.  


2. A railroad proposed a large rate increase on captive movements. The railroad was shown that its rates were already in the upper profitability quartile for moves in certain markets. Additionally, the railroad was shown that its proposed rate increases are higher than the average increase they are receiving from all movements of this commodity.

Result –  Railroad pulled back its rate increases, reduced rates on priority movements and signed a multi-year contract. 


3. A shipper performed an analysis of the profit structure for a company’s movements on its primary railroad. The analysis showed that the railroad was pricing its movements above competitors on both captive and competitive traffic. A Rate Benchmark Analysis showed the rate structure needed to maintain and increase volumes in problem markets. 

Result – Rates were reduced in significant problem markets and the railroad increased the strike price for fuel surcharges without increasing the rates for movements.


4. The rates and the rail carriers’ profits on all movements from an important market area were analyzed. This determined the market price for the commodity and the impact of increased volumes and lower rates on railroads profit.

Result – Win/win opportunities associated with lower rates were put in place to the benefit of both the shipper and rail carrier. 


5. Rail rates for all coal movements originating in the PRB and terminating in a specific state were determined.  The range of rates being obtained by plants with and without competitive options was used to support the rates that were and were not reasonable for plants.

Result – Shipper obtained rates in line with its competitor’s plants.


6.The shipper determined competitors’ rates into markets to find out where its rail rates were putting it at a competitive disadvantage in markets.  

Result – Rates were reduced in primary markets to keep the shipper competitive.


7. Shipper determined the railroad’s cost and profit for movements and how its rates stacked up to others in major markets.   

Result – Rates in several primary markets were reduced to minimize the shipper’s competitive disadvantage in these markets. 


The common theme in these examples, is that the shipper was able to gather information on its markets.

This data allows shippers to clearly demonstrate a problem to the railroad and quantify the rate that provided an equitable solution. The point to be taken is that shippers who are well prepared for negotiations have better negotiations. They also get better rates than shippers that do not completely understand their markets. Rate benchmarking and the costing of rail movements provides ammunition that helps protect rail shippers from excessive rates charged by railroads. These resources are important to help counteract the monopoly or duopoly power railroads have over their customer’s traffic.

When railroads have monopoly power over movements it is up to the shipper to determine if the railroad is abusing this power. Thus, putting the shipper’s business at a competitive disadvantage.

Railroads are sensitive to hurting a companies’ ability to compete in markets. Therefore, benchmarking your rates against competitors is a productive exercise in preparing for rate negotiations. This can be the most productive and least costly option shippers have for obtaining competitive rates for their traffic. 

Uncovering, and quantifying rate problems is a major function of effective transportation departments! Many transportation professionals have found that determining reasonable rates for traffic is the first step in obtaining better rates.

Escalation Consultants, Inc. developed the Rail Cost Control (“RCC”) program to help shippers reduce rail expenses by managing costs and empowering negotiations. For more information about RCC and other related articles, visit the RCC Blog.
 

Rail Cost Control


https://www.railcostcontrol.com/wp-content/uploads/6.png 1080 1080 Keith Nestman https://www.railcostcontrol.com/wp-content/uploads/RCC-Logo-2026.svg Keith Nestman2021-05-05 08:00:062021-06-01 13:45:21Why Some Rail Shippers Get Lower Rates
RCC Blog - Uploads to STB's Carload Waybill Sample

Updates to STB’s Carload Waybill Sample

April 28, 2021

Big improvements Coming to the STB’s Carload Waybill Sample

The best source for understanding railroad rates and volumes for commodities into specific markets is the STB’s Public Use Waybill Sample (Waybill). The Waybill contains information that can significantly impact a shipper’s rail negotiations. It can also positively impact decisions made in shipper’s marketing and sales departments. Improvements made to Waybill data are, therefore, important for shippers to understand.

There are two big improvements in the Waybill data for merchandise traffic that shippers must be aware of. The first improvement will go into effect later in 2021 or early 2022. The second improvement is still being studied by the STB.

Waybill Improvement 1

The upcoming 2020 Waybill will contain more rates, volumes, origins, and destinations for merchandise traffic rail movements. This means merchandise traffic will contain:

  • Increased number of origin and destination market areas.
  • More accurate estimates of specific commodity volumes going into markets.
  • More accurate estimates of where volumes into markets originate.
  • Improved information on rates shippers compete against in markets.

This increase in merchandise traffic data will be offset by decreasing the number of intermodal movements the Waybill contains. This change is being implemented because the Waybill is primarily used by merchandise traffic shippers. These improvements will go into effect with the release of 2020 Waybill data. The 2020 Waybill data is expected to be released in late 2021, or early 2022.

Waybill Improvement 2

If this improvement is implemented, the Waybill will be released Quarterly, not Annually. This improvement is still being studied by the STB. However, if this change is enacted, Waybill data will become much more current.

In the existing system, Waybill data is at least one year old. Much of the data is closer to two years old before the STB releases an updated Waybill. For example, if the Waybill data for year 2020 is released in December 2021, there will be a one-year lag in data for the fourth quarter of 2020. However, there will be close to a two-year lag for data from the first quarter of 2020.  The new quarterly Waybill system would only have a two-to-four-month delay in rate and volume information for all Waybill data.

Waybill Improvement 2 is important because the more current Waybill data is, the more useful Waybill data becomes!

Importance of Waybill Data

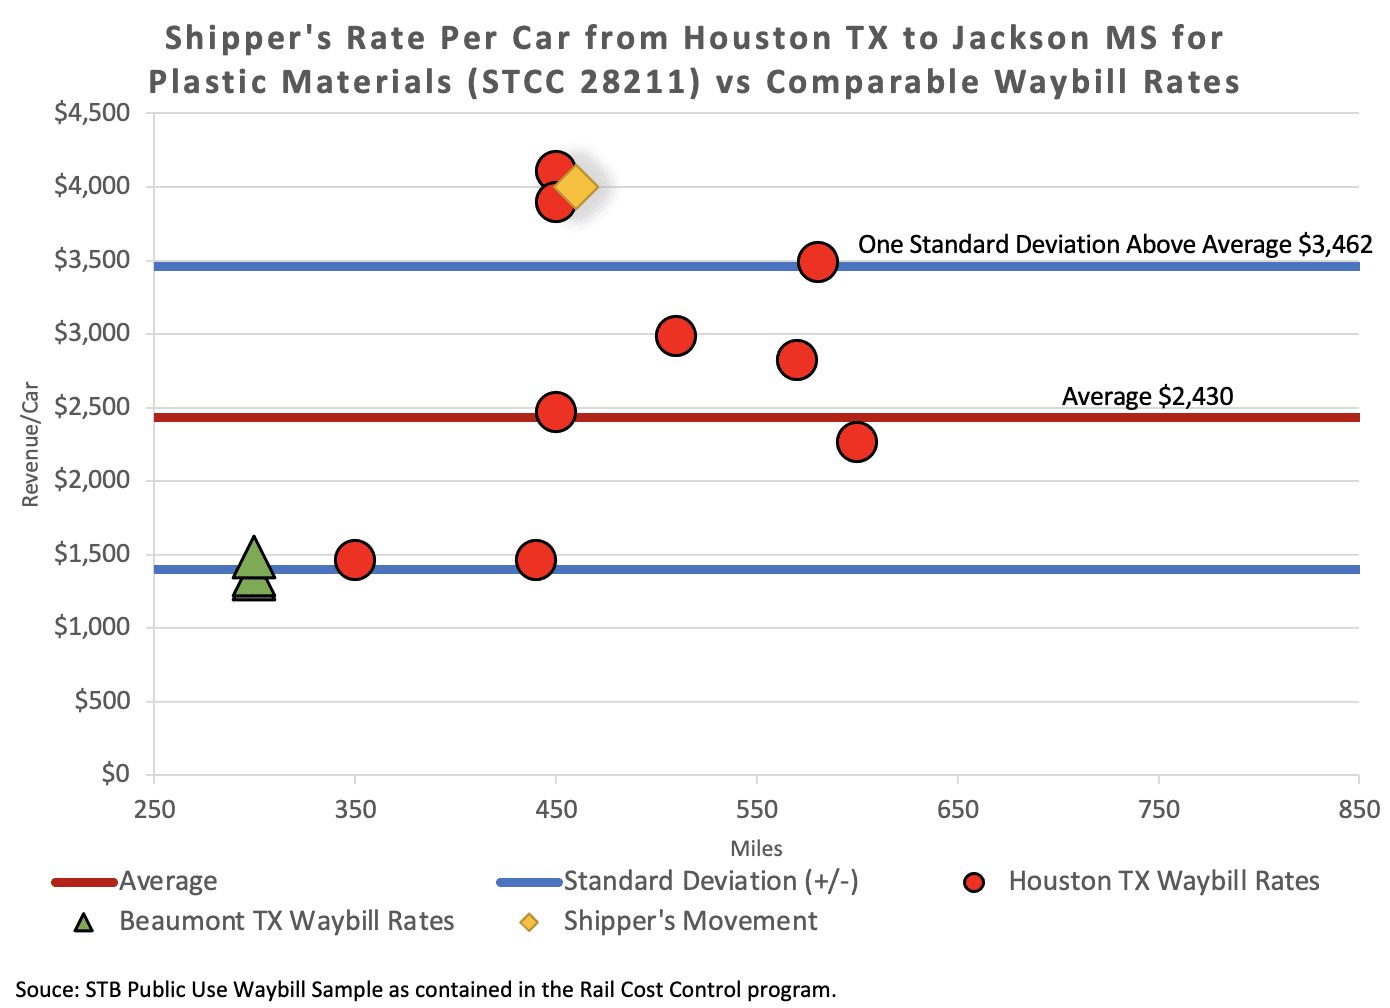
The importance of the Waybill data in determining reasonable rates for rail movements is shown in the following scatter graph:

Updates to STB’s Carload Waybill Statistics

The scatter graph is automatically generated through the Rail Rate Checker Section of the Rail Cost Control Program

The graph shows the following data:

  • Shipper’s rate of $4,000 for a 450-mile Plastic (STCC 28211) movements from Houston, TX to Jackson, MS (yellow diamond)
  • Waybill rates for Plastic moves to Jackson, MS from both Houston, TX (red circles) and Beaumont, TX (green triangle)
  • A $2,430 Average Waybill rate into Jackson, MS (refer to the red line)
  • $3,462 is the rate that is One Standard Deviation above the average Waybill rate (refer to the top blue line)

The graph shows the value shippers get from access to Waybill data. The illustration provides a clear picture of the problems with the $4,000 rate for the shipper’s Plastic movements. The graph shows:

  • The $4,000 rate is more than One Standard Deviation above the Average rate into Jackson, MS
  • Houston rates are $1,000 to $2,5000 higher than rates out of Beaumont, TX
  • The $4,000 rate puts the shipper at a competitive disadvantage in the Jackson, MS market
  • It is difficult for the shipper to compete in this market with a $4,000 rail rate

The Waybill is already a very valuable tool for rail shippers. The STB’s proposed improvements to timeliness and number of moves, will increase the value of the Waybill for rail shippers.


Escalation Consultants, Inc. developed Rail Cost Control (“RCC”)  to help shippers reduce rail expenses by managing costs and empowering negotiations. Furthermore, for more information about RCC and other related articles, visit the RCC Blog.
Rail Cost Control

https://www.railcostcontrol.com/wp-content/uploads/7.png 1080 1080 Keith Nestman https://www.railcostcontrol.com/wp-content/uploads/RCC-Logo-2026.svg Keith Nestman2021-04-28 08:00:462021-05-26 15:54:49Updates to STB’s Carload Waybill Sample
RCC Blog - Historical Data Shippers Need

Historical Data Shippers Need

April 21, 2021

There is little information available on policies and practices shippers rail transportation departments are using to control their cost of rail freight. As a result:  

There is little direction for shippers to follow on changes that can be made within the transportation department to obtain better results from railroads. 

The results of the survey taken at Escalation Consultants’s recent webinar, “Creating Opportunities to Reduce Rail Expenses” are therefore very informative as they provide:

  • Information on the current state of the art in shippers rail transportation departments and 
  • Food for thought on changes that can be made in transportation departments to obtain better rates from railroads

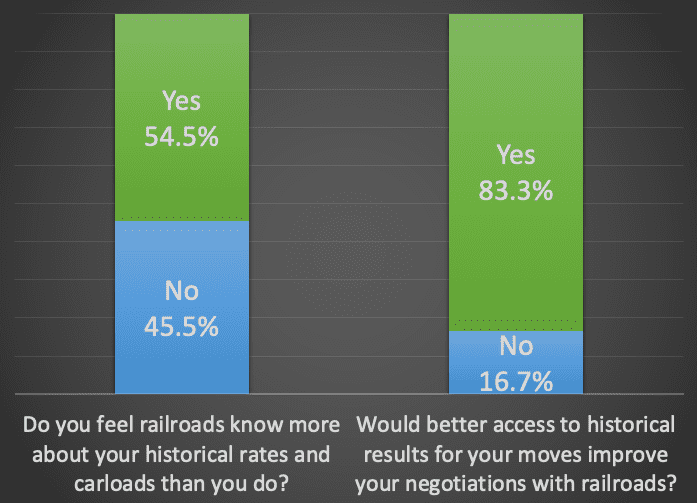
One of the most interesting results was: 83% of shippers said that better access to historical results for their moves would improve negotiations with railroads. It is difficult to get people to agree on 83% of anything, so this indicates a real need for better access to historical rate and volume information.  

A reason for shippers wanting better access to historical results is found in the response to the question: 

“Do you feel railroads know more about your historical rates and carloads than you do?” 

55% of shippers answered YES!

This indicates that railroads frequently know more about how shipper’s volumes and rates have changed than shippers do. This represents a big problem for shippers. Your railroad knows how your rates and volumes have changed.  If past large rates increases are not addressed in current rate negotiations, this indicates one of two things: 

  • You have forgotten about the large rate increases of the past; or, 
  • Large rate increases are not causing you a problem. 

Either situation can be detrimental to a shipper’s rates. Silence is Not Your Friend! It does not send the proper message to a railroad. 

historical changes in rates and volumes - poll 2

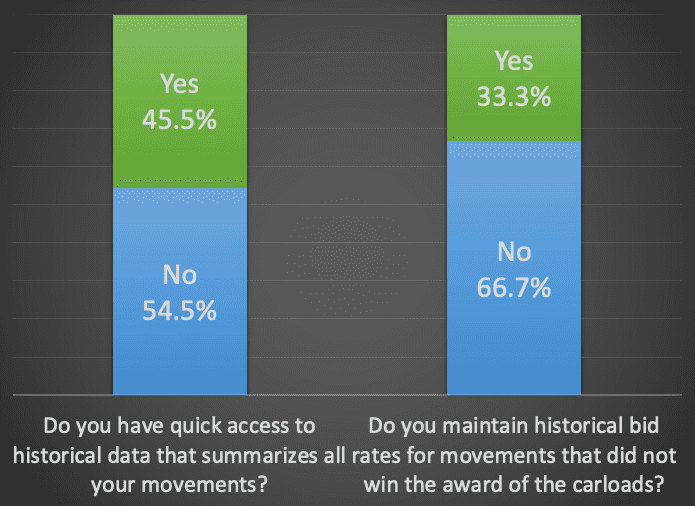
Another interesting result is that 55% of the shippers answered that they do not have access to historical data that summarizes all the historical changes in their movements. This means that it is difficult for these shippers to demonstrate the problems that past rate increases are having on their current business. This also provides some context for why 83% of the shippers answered that better access to historical rates and volumes would improve their negotiations with railroads. This is what the Rail Cost Control (RCC) program’s Database Management System provides to shippers!

The webinar provided examples of the impact that historical changes in rates and volumes can have on your rate negotiations with railroads. To gain access to a recording of the webinar contact EC.

Another interesting response: “Do you maintain historical bid rates for movements that did not win the award of carloads?”

Only 33% answered YES!

It can be very helpful to know how much a railroad missed the award by in the last bidding cycle. Railroads always say that their bid rates reflect the current market. It is good to be able to point out how their rates have been above market rates in the past. This provides shippers more credibility when discussing the rates needed for railroads to be successful in the current bid solicitation. This is especially relevant if you are going to be proactively establishing rates for your movements with railroads by providing:

– The Rates you need,
-The Reason why you need them,
-And the Reason the railroad should give them to you.

historical changes in rates and volumes - Poll

In Escalation Consultants’ experience, negotiations with railroads dramatically improve, when you establish an informed narrative. 

This narrative refers to: the Rates you need, the Reason you need them, and the Reason the railroads should give them to you. Knowing how your rates have changed in the past, directly impacts the quality of your story. Leveraging this data dramatically improves your likelihood of obtaining better rates in the future. 

The source of this data was the first in a series of three webinars that will address industry trends, strategic planning, and specifically designed tactics shippers can use to improve their rail negotiations and decrease rail expenses.   

We hope you will join us again for Webinar #2 in May. This webinar will cover: Optimizing Your Spend on Each Railroad to Significantly Reduce Your Rail Expenses. 


Escalation Consultants, Inc. developed Rail Cost Control (“RCC”)  to help shippers reduce rail expenses by managing costs and empowering negotiations. Furthermore, for more information about RCC and other related articles, visit the RCC Blog.
Database Management System

https://www.railcostcontrol.com/wp-content/uploads/8.png 1080 1080 Keith Nestman https://www.railcostcontrol.com/wp-content/uploads/RCC-Logo-2026.svg Keith Nestman2021-04-21 08:00:362021-05-26 16:19:43Historical Data Shippers Need
Database Manager System

Generate Maximum Savings Through Optimizing

April 14, 2021

The blog titled “Optimizing to Reduce Shippers Rail Expenses” showed the process shippers can use to reduce rail expenses by millions of dollars while, at the same time, increasing railroad profit by millions of dollars. This value is created by optimizing railroads rates during a shippers bid evaluation. Win/Win opportunities are created by understanding the relationship between: 

The Reduction in Spend a Shipper Receives from Reduced Rates 

in Relation to 

the Increase in Profit the Railroad can Receive from Obtaining Additional Volumes 


The question that needs to be answered is how does a shipper determine the maximum value it can create through the optimizing process? Determining maximum value from optimizing is important as it brings the rate level of captive movements into rail negotiations. To do this a shipper needs to know the Pivot Point for awarding competitive carloads on each railroad.     

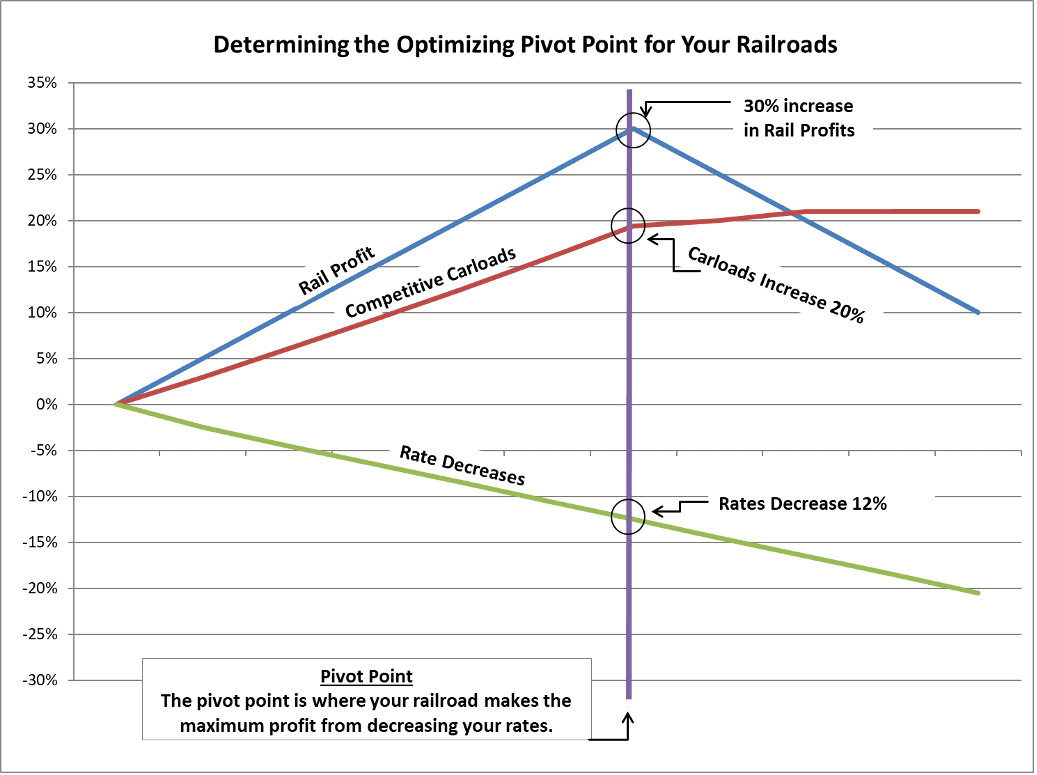
The Pivot Point represents the point where a railroad makes the maximum profit from reducing a shipper’s rates. 

Once the Pivot Point is reached, it becomes less attractive for a railroad to decrease rates to get the award of more competitive carloads. The Pivot Point shows when a rate reduction for the shipper is no longer offset by railroad profit obtained from an increase in carloads.

Illustration 1 demonstrates what goes into determining the Pivot Point. Illustration 1 shows that a 12% decrease in bid rates for a railroad’s competitive traffic is the Pivot Point. This decrease results in a 30% increase in the railroad’s profit resulting from a 20% increase in competitive carloads for the railroad. To get the most out of rail negotiations it is important for shippers to know the Pivot Point for rate reductions on each of their railroads. 

Rail Cost Control Pivot Point

Calculating the Pivot Point is an iterative process that continues to reduce rates on competitive movements for a railroad. With each rate reduction carloads are then re-award based on the lowest bids for competitive movements to determine the impact on both the railroad and the shipper. 

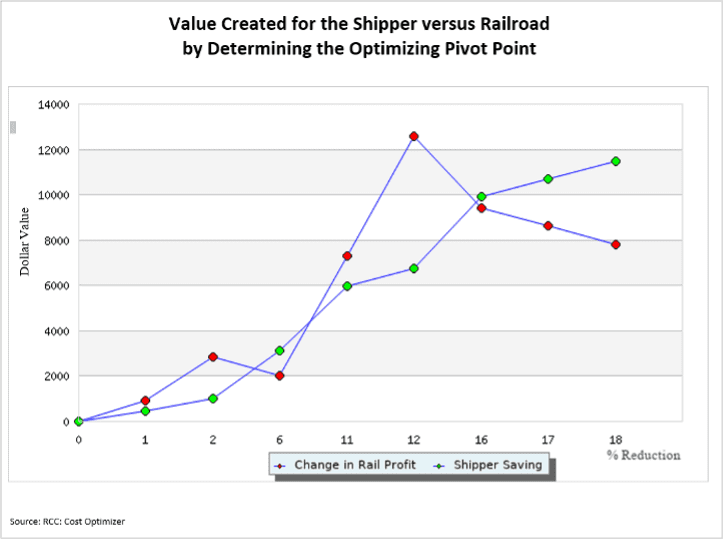
These changes are continually calculated until the Pivot Point is determined. Illustration 2 provides the results of this iterative process for the railroad used in our analysis. This graph shows the dollar savings for the shipper in relation to the change in rail profit for the railroad. These changes result from rate reductions of 1% to 18% in a railroad’s bid rates.

(Note to visually see the impact on rail profit and shipper savings, all dollar values are shown as positive amounts)

A 12% reduction in competitive rates represents the Pivot Point, as this generates the maximum amount of profit the railroad obtains from the award of more carloads. Railroad profit starts decreasing with rate reductions greater than 12%. Shipper’s savings continue to increase with rate reductions but by a 16% reduction the benefit to the shipper is greater than to the railroad. The source for Illustration 2 is the Rail Cost Control Program (RCC).

Rail Cost Control Pivot Point Optimized

Initially, the Pivot Point normally generates greater value for railroads than shippers.

This is because it represents the maximum increase in profit a railroad can get from reducing its rates. The table below demonstrates this as it summarizes the results for the rail bids used in this article.


Table 1

Summary Results for a 12% Rate Reduction on a Railroads Competitive Rates  

Shipper Savings 

$6.7 million 

Increase in Railroad Profit 

$12.5 million 

Increase in Railroad Revenue 

$23.0 million 

Increase in Railroad Carloads 

5,100 

**Table 1 Source: Output Table from the RCC – Cost Optimizer**

Table 1 shows that the railroad makes out much better than the shipper. The railroad makes $12.5 million in additional profit, while the shipper receives savings of $6.7 million. This difference brings rate reductions for captive movements into the optimizing process. Rates for captive movements become part of an iterative process that determines the best split of the benefits between the shipper and railroad through the optimizing process. The source for Table 1 is the Rail Cost Control Program.

Table 2 provides the results from optimizing after rate reductions for captive rates are included in the optimization process. This table shows the shippers expense is reduced by $9.6 million while the railroads profit is increased by $9.6 million. This is a good deal for the railroad as it makes $9.6 million more in profit and $20 million more in rail revenue than it would receive based on its initial bid rates. This is also a good deal for the shipper as its rail expenses are reduced by $9.6 million.

Table 2

Change from Bid Rates Summary Results After Captive Rates are Included in the Optimizing Process

Shipper Competitive Spend Saving

-$6,814,188

Shipper Captive Spend Savings

-$2,826,917

Shipper Total Savings

-$9,641,105

Railroad Competitive Profit

$12,556,031

Railroad Captive Profit

-$2,904,317

Increase in Total Railroad Profit

$9,651,714

Increase in Railroad Spend

$20,135,460

Increase in Railroad Carloads

$5,100

**Table 2 Source – Output Table from the RCC – Cost Optimizer**

When shippers are armed with opportunities created by optimizing rail expenses, they create value for themselves and their railroads. Shippers reduce the rate structure for their movements, while substantially improving profit and carloads for railroads.

The best negotiations are win/win negotiations and optimizing creates this type of negotiation. Therefore, the question is, why haven’t more shippers used optimization to reduce their rail expenses?  The answer is complexity and time constraints. This was the reason for the development of the Rail Cost Control (RCC) Program. The algorithms in the RCC’s Cost Optimizer automatically determine the Pivot Point for each railroad and the results to expect from the optimizing process, for both the shipper and railroad. This is a game changer for many companies.


For more information on optimizing rail expenses, check out the Rail Cost Optimizer. 

Escalation Consultants, Inc. developed Rail Cost Control (“RCC”)  to help shippers reduce rail expenses by managing costs and empowering negotiations. Furthermore, for more information about RCC and other related articles, visit the RCC Blog.
Rail Rate Checker Banner

https://www.railcostcontrol.com/wp-content/uploads/Screen-Shot-2021-03-01-at-7.30.49-AM.png 484 761 Keith Nestman https://www.railcostcontrol.com/wp-content/uploads/RCC-Logo-2026.svg Keith Nestman2021-04-14 08:00:042021-06-01 13:48:10Generate Maximum Savings Through Optimizing
Page 5 of 7«‹34567›»

Pages

  • About Us
  • AXIS
  • Contact Us
  • Cost Optimizer
  • Costing Dashboard Update
  • Database Management System
  • Evaluation Exercise Calendly
  • Evaluation Exercise Contact Form
  • Home
  • Landing Page – 2025
  • Movement Evaluation Exercise
  • News & Events
  • PopUp Testing 05172021
  • Privacy Policy
  • Rail Cost Control Demo
  • Rail Rate Checker
  • Seminars and Training
  • YT

Categories

  • Uncategorized

Archive

  • August 2026
  • June 2026
  • May 2026
  • March 2026
  • February 2026
  • January 2026
  • December 2025
  • November 2025
  • October 2025
  • September 2025
  • June 2025
  • November 2024
  • October 2024
  • June 2024
  • February 2024
  • September 2023
  • August 2023
  • July 2023
  • June 2023
  • February 2023
  • January 2023
  • June 2022
  • February 2022
  • January 2022
  • December 2021
  • October 2021
  • August 2021
  • July 2021
  • June 2021
  • May 2021
  • April 2021
  • March 2021
  • February 2021
  • January 2021
  • December 2020

Rail Cost Control is a product of Escalation Consultants, Inc.—serving railroad customers since 1979.

Quick Links

  • AXIS
  • Rail Rate Checker
  • Cost Optimizer
  • Database Management System
  • News & Events
  • Seminars & Training
  • About Us
  • Contact Us
  • Login

Contact Info

4 Professional Drive, Suite 129
Gaithersburg, MD 20879

info@railcostcontrol.com
301-977-7459 

linkedinfacebook

© 2025 Rail Cost Control. All Rights Reserved.

Scroll to top

Access FREE Trial to Rail Cost Control and Uncover Savings in Seconds